


Recent
Most read

In the run-up to Christmas Ofqual released its latest data on reviews for marking and moderation, revealing that the number of GCSE and A-level grades that were challenged had risen year-on-year by almost 30,000 to 331,330.
Of those challenged grades, 22.5 per cent were increased - representing a slight rise from 21.8 per cent last year. However, only 1.2 per cent of the total number of grades changed.
Beyond the topline data, though, is a raft of other insights provided by Ofqual in its . These raise some intriguing questions around exam marking, and may help teachers and subject leads decide how to focus any reviews of marking.
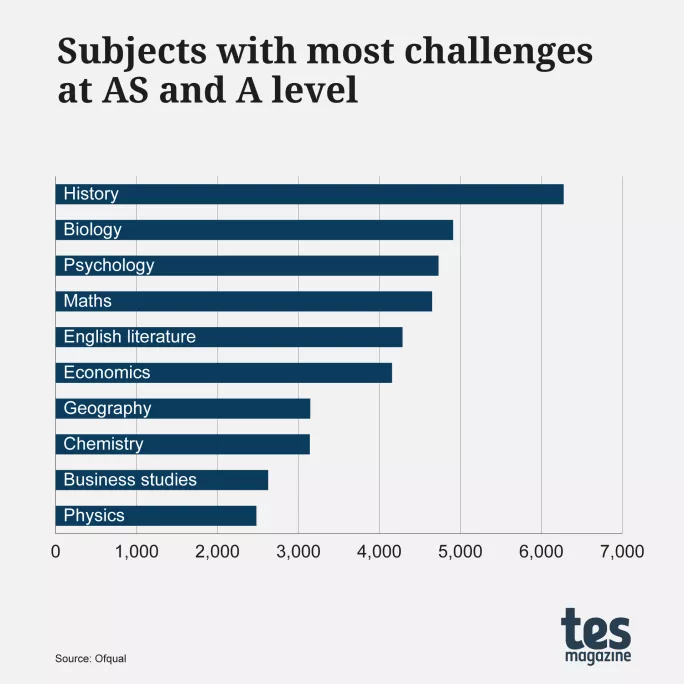
For instance, looking at AS and A levels, data on table 11 reveals that the subjects with the most challenges were as follows: history (6,275), biology (4,910), psychology (4,730), maths (4,650) and English literature (4,285).
╠²
Are these subjects marked the worst? Well, given that these are subjects with many entries, it is not surprising they attract more challenges, so perhaps this is not the best measure.
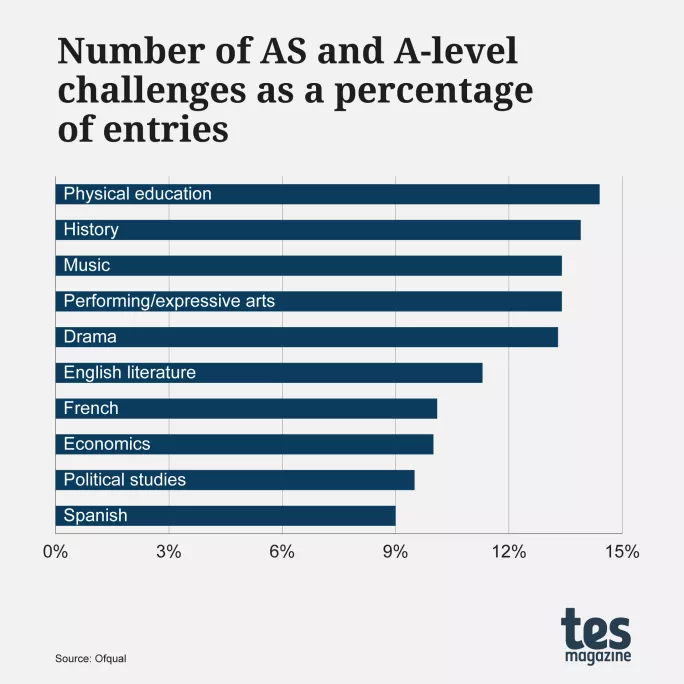
Perhaps the number of challenges as a percentage of the number of entries is a better measure - and this does, indeed, give us a different view: physical education (14.4 per cent), history (13.9 per cent), music (13.4 per cent), performing/expressive arts (13.4 per cent) and drama (13.3 per cent) top the list, with an all-subject average of 7.1 per cent.
╠²
Overall, though, what does a higher number or percentage of challenges indicate? Is it that the quality of that subjectŌĆÖs marking is relatively poor? Is the level of trust in that subjectŌĆÖs marking relatively low? Or are these subjects just more subjective to mark and so worthy of appeal? Certainly, PE, music, performing arts and drama would seem to fall into that latter category.
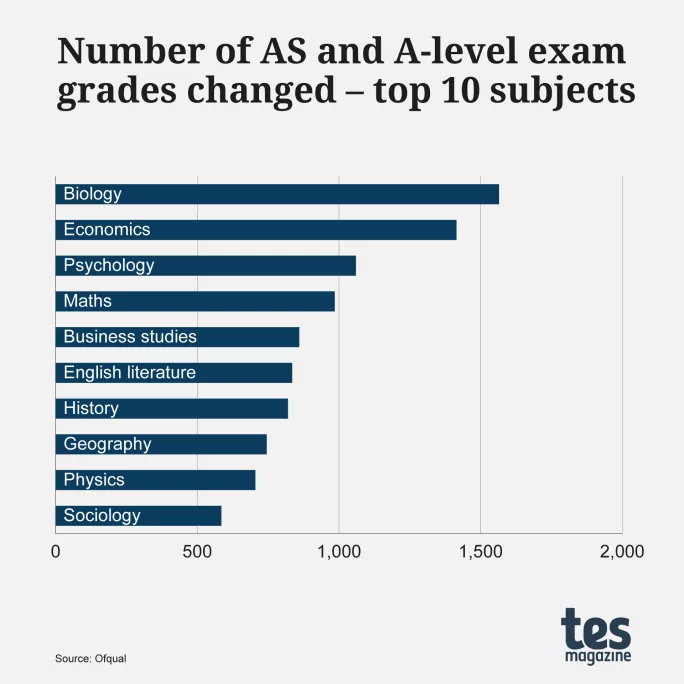
Perhaps a better measure is the number of grades changed overall - which gives us another ranking, and one that may surprise you: biology (1,565), economics (1,415), psychology (1,060), maths (985) and business studies (860) top this list.
╠²
Surely biology, maths and economics, at least, are more ŌĆ£empiricalŌĆØ subjects in which answers should simply be either right or wrong? Given how many challenges lead to grade changes, though, theyŌĆÖre clearly not. This is something to bear in mind on the next results day when a student swears they thought they did well in any of these subjects.
However, in terms of the percentage of all entries that were challenged and led to a change, we get another list: economics (3.4 per cent), music (3.0 per cent), physical education (2.6 per cent), political studies (2.6 per cent) and design and technology (2.5 per cent).
This is the data that, across all subjects, gives an overall figure of 1.6 per cent for the proportion of AS and A levels taken for which grades were changed. Given that thousands of papers are marked, it perhaps does not sound so bad on the surface.
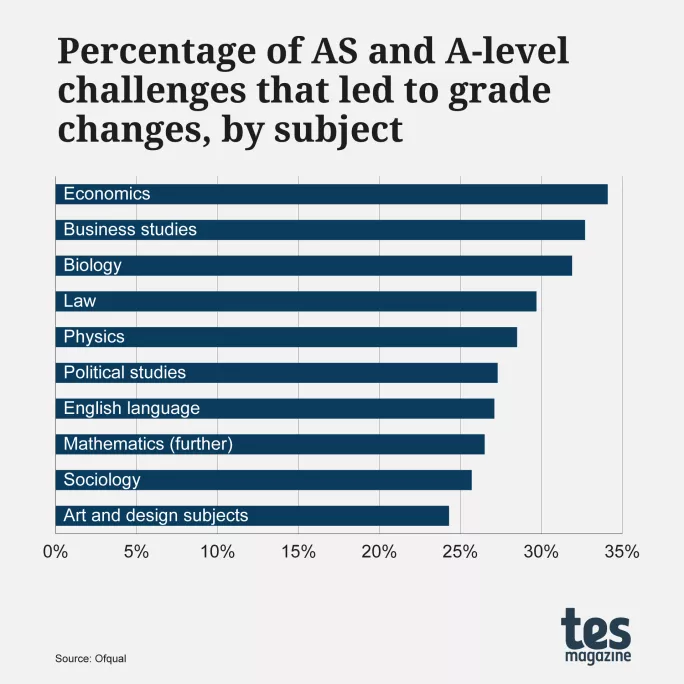
Finally, since a grade can only be changed if it has been challenged, probably the best available measure of the reliability of marking is the data that reveals the number of grade changes as a percentage of the number of challenges.
Top of this list are economics (34.1 per cent), business studies (32.7 per cent), biology (31.9 per cent), law (29.7 per cent) and physics (28.5 per cent) - and the all-subject average is 23.1 per cent.
╠²
ItŌĆÖs worth really analysing these figures. They mean that for economics, business studies and biology, any challenge has a one-in-three chance of a grade being changed - strong odds for a student who may be desperate for a change to hit their university application requirements.
Physics and law with a one-in-four chance - and, indeed, the overall one-in-five rate - make the idea of appealing seem worthwhile in such a high-stakes system.
ThereŌĆÖs another consideration, too. For economics, for example, the number of grades challenged (4,155) was 10 per cent of those awarded (41,590). If about one grade in every three of those challenged was changed (34.1 per cent), how many grade changes would there have been had all 41,590 grades been challenged?
WeŌĆÖll never know but the data suggests there would be many more.
Overall, while no system can be foolproof, the data shows that exam marking errors are hardly rare and certain subjects are perhaps more worthy of a challenge than others - something teachers and subject leaders should bear in mind next exam results day.
Dennis Sherwood is author of
For the latest education news and analysis delivered every weekday morning, sign up for the Tes Daily newsletter