Spark Science provides high quality science educational resources for secondary school teachers.
From dual-coding, literacy and reading tasks, dyslexic friendly backgrounds, and continual Assessment for Learning (AfL) tasks embedded into all our lessons, Spark lessons will increase engagement, participation and understanding for your students.
This lesson introduces students to the concept of word equations and what we do and do not include in one.
In this lesson students will learn how to write word equations from sentences, turn sentences into word equations and identify reactants and products in a word equation.
This lesson is the second lesson in the KS3 "Chemical Reactions” topic, though can be taught as a stand alone lesson. It is designed with non-specialist teachers in mind, being easy to follow and present, and comes with complete answers to all activities and examples built into the powerpoint slides, along with hints and tips about lesson delivery in the powerpoint’s “notes” section.
Lesson objectives:
Identify the reactants and products in a word equation
Write word equations for simple chemical reactions
Turn word equations into sentences/paragraphs
Describe how atoms rearrange and join together differently in a chemical reaction
Lesson features:
Interactive powerpoint with delivery tips/notes
Intergrated answers on slides
Built in AfL and mini-whiteboard checks
Scaffolding and “I do, we do, you do” tasks
Stretch and challenge tasks throughout
This lesson contains:
Lesson powerpoint (pptx.)
Writing Word Equations Worksheet (PDF)
Worksheet answers (PDF)
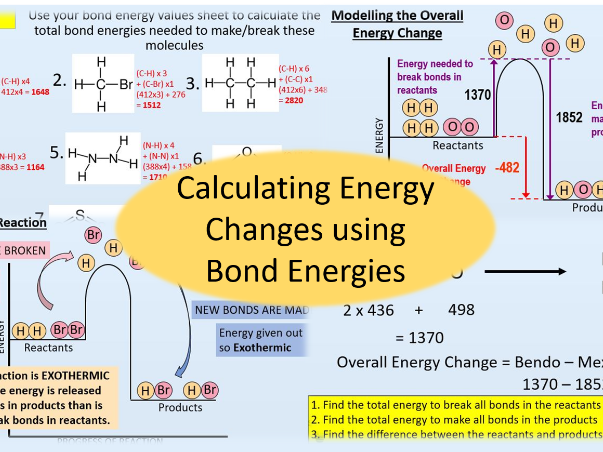
In this lesson students will learn what a bond energy is and how to use bond energies to calculate the overall energy change of a chemical reaction.
This lesson also links the overall energy calculations to the reaction profile diagrams students will have met in “Energy Changes 1”, allowing students to make visual links between their calculations and the profile diagram of the reaction taking place.
This lesson is the first lesson in the “Energy Changes 2” topic, and assumes that students have already learned about reaction profile diagrams and the basics of exothermic and endothermic reactions.
Lesson Objectives:
Describe what a bond energy is
Know whether breaking and making bonds are exothermic or endothermic
Calculate the overall energy changes for reactions using given bond energy values
Resource features:
Interactive powerpoint including teacher delivery notes and full answers throughout
Plenary task
Stretch and challenge tasks throughout
Clear diagrams, worked examples and scaffolding for calculations
Resource includes:
Lesson Powerpoint (pptx.)
Overall Energy Change Calculations: Student Worksheet (PDF)
Overall Energy Change Calculations: Answer Sheet (PDF)
Printable Bond Energy Values Tables for students (PDF)
This lesson recaps the parts of the light microscope students have met in KS3, and introduces students to the electron microscope and the advantages and disadvantages of both types of microscope.
This is the first lesson in the “Cell Structure” topic. This topic is designed to act as a “bridging topic” between KS3 and KS4 biology, introducing students to some of the basics of the GCSE biology syllabus (relevant to both combined and separate science courses)
Lesson Objectives
Label the parts of a light microscope
Describe what magnification and resolution are
Describe the advantages and disadvantages of using a light and electron microscope
Features
Challenge tasks throughout
Complete answers for all tasks included either in notes section of powerpoint or integrated into powerpoint presentation
Student led reading and literacy task
Two whole class AfL tasks/activities
**Materials included: **
Lesson powerpoint (pptx.)
Student literacy/reading worksheet (PDF)
This bundle contains all the lessons you need to cover the KS3 English National Curriculum on Space.
These lessons are designed to be easy to teach (especially for non-specialists), interactive, student-led, and AfL filled/driven.
These lessons contain video links, various online simulations for students to use to aid their understanding and sense of wonder, PDF worksheets, complete PDF answer sheets, answers to all powerpoint questions (either incorperated into the powerpoint slides or in the notes sections), teacher delivery notes/tips in the “notes” sections of the powerpoints, stretch and challenge tasks for higher ability students throughout each lesson, various AfL tasks (e.g. finger voting/mini-whiteboards/true-false quizzes), and plenary tasks for each lesson.
This bundle contains the following lessons:
The Night Sky
The Solar System
Formation of the Solar System
Why we get Seasons
Phases of the Moon
Eclipses
This lesson is the sixth and final lesson in the “Space” topic and covers what solar and lunar total/partial eclipses are and why they happen. The lesson contains an optional class practical/demonstration of eclipses, AFL mini-whiteboard tasks to assess understanding, video task, and stretch and challenge tasks for higher ability students throughout.
This lesson is designed to be easy to teach, student led, and is ideal for non-specialist teachers.
This Lesson Contains:
Lesson powerpoint, including activity delivery instructions and tips for teachers, full answers, mini-class practical instructions, plenary task, AFL whiteboard tasks, and relevant video link
Student eclipses worksheet (PDF) and answer sheet (PDF)
Lesson Objectives:
State what a solar and lunar eclipse are
Explain how solar and lunar eclipses happen
A comprehensive, engaging, challenging, and interactive lesson package designed with non-science/non-chemistry specialist teachers in mind.
This lesson covers content from GCSE AQA Chemistry and Combined Science Trilogy.
It covers the properties, structure and bonding in graphite and diamond, as well as explaining the key properties of diamond and graphite (electrical conductivity, melting point, hardness) to its structure and bonding.
This lesson contains:
Lesson powerpoint - including teacher notes, delivery instructions and answers in “notes” section
Bank of exam style questions on graphite and diamond taken from past AQA papers with mark schemes (PDF and editable versions)
Printable images of graphite and diamond for students to annotate (PDF and editable versions)
Lesson resources contain:
In-built challenge tasks throughout
AFL mini-whiteboard tasks throughout
In-built scaffolded learning for lower abilities and alternative task for lower ability classes
Colour coding throughout to aid EAL, SEN and other learners
Various activites to assess progress and understanding that you can tailor to fit any class or available resources
Full answers to all questions (mostly automated into slides to make it easier for you to deliver)
Objectives:
Students will be able to…
State some properties of diamond and graphite
Compare the properties of diamond and graphite
Compare the structure and bonding in diamond and graphite
Explain the similarities and differences in the properties of diamond and graphite in terms of structure and bonding
This lesson is the fifth lesson in the “Space” topic and covers why the moon appears to change shape in our sky and the names of the phases of the moon. The lesson contains a mini-student practical, AFL mini-whiteboard tasks to assess understanding, challenge tasks for higher ability students, and a link to an online modelling software that really helps students understand the changing phases of the moon.
This lesson is designed to be easy to teach, student led and is ideal for non-specialist teachers.
This Lesson Contains:
Lesson powerpoint, including activity delivery instructions and tips for teachers, full answers, simulation link, mini-class practical (and optional alternatives), plenary task, AFL whiteboard tasks and discussion activities
Student phases of the moon worksheet (PDF) and answer sheet (PDF)
Lesson Objectives:
Name/Sketch/Describe the phases of the Moon
Explain why you see phases of the Moon
This lesson is the fourth lesson in the “Space” topic and covers why we get different length days and different temperatures at different times of year. The lesson contains a mini-student practical, animated gifs to illustrate concepts clearly, AFL miniwhiteboard tasks to assess understanding, and a link to an online modelling software that really helps students understand the changing angles and position of the sun at different times of year.
This lesson is designed to be easy to teach, student led and is ideal for non-specialist teachers.
This Lesson Contains:
Lesson powerpoint, including activity delivery instructions and tips for teachers, full answers, gif illustrations, simulation link, plenary task, AFL whiteboard tasks and discussion activities
Lesson Objectives:
Explain the apparent motion of objects in the sky
Explain why hours of daylight and temperature change during the year
Describe seasonal changes in different places on Earth
This lesson is the third lesson in the “Space” topic and covers the basics of how our solar system formed. The lesson contains links to online videos, whole class AFL tasks to assess understanding and two independent tasks for students to complete.
This lesson is designed to be easy to teach, student led and is ideal for non-specialist teachers.
This Lesson Contains:
Lesson powerpoint, including activity delivery instructions for teachers, full answers, AFL whiteboard task and discussion activities
Student Gap fill summary worksheet (PDF) AND answer sheet (PDF)
Student crossword activity worksheet (PDF) AND answer sheet (PDF)
Lesson Objectives:
Describe how the Solar System formed
This is a good practice worksheet for lessons or homework to get students to practice drawing dot-and cross diagrams, drawing 3D structures of molecules and ions, identify molecular shapes and bond angles.
Comes with worksheet and completed answer sheet.
Designed for the OCR A A-level course but will be applicable to all A-level chemistry courses.
This bundle is the complete lesson resources needed to teach core “Working Scientifically” skills to KS3 students, following the UK national curriculum.
These lessons are interactive, engaging, student-led and focused. This topic contains careers links, reading opportunities and AFL strategies throughout (including mini-whiteboards and finger voting) to help you know how your students are doing.
All questions, worksheets and tasks come with complete answers.
Lessons included:
Accuracy, Precision and Hypotheses
Writing risk assessments
Choosing graphs and Drawing Pie Charts
Calculating Means, Medians and Modes
Reading and Analysing Graphs
Communicating Scientific Information
Bias, Evidence and Peer-reviewing
This is the 5th lesson in the “Working as a Scientist 2” Year 8 topic.
This lesson teaches students how to identify relationships in graphs using the line of best fit and how to describe trends in graphs. It also covers the ways we can improve our confidence in graphs/data, how to deal with outliers, and how to read values from a graph using the line of best fit.
It is a comprehensive lesson, with large amounts of student participation on mini-whiteboards (so loads of chances for AFL and intervention if needed). The lesson can be lenghtened or shortened with slides cut out depending on student ability and prior knowledge.
Students can then practice their skills independently by drawing and analysing their own graph on the student worksheet.
Lesson resources:
Lesson powerpoint with all answers built in automatically, various mini-whiteboard AFL tasks for students, discussion activities, scaffolding and dual coding to support lower ability/EAL/AEN students.
Student worksheet PDF
Student worksheet answers PDF
Lesson objectives:
Identify linear and directly proportional relationships
Take readings from a graph using a line of best fit
Describe how to improve confidence in conclusions made from graphs
For this lesson you will need mini-whiteboards
This lesson is lesson 6 in the Year 8 “Working as a Scientist 2” topic.
This lesson focuses on how we communicate science to different audiences, and how we can tailor our writing and presentation of information to suit them.
This lesson is designed to be a “click and teach” lesson with minimal planning needed from the teacher, which is great for non-specialist teachers.
Lesson resources contain:
Lesson powerpoint containing class activities and instructions, teacher delivery notes in “notes” section, discussion slides and full answers.
PDF copies of different types of scientific communication (A childrens science book, newspaper article and scientific journal article) all about melting ice caps.
PDF copy of a simple scientific journal article for students to adapt about the effects of temperature on seed germination (Students should have already looked at germination in Year 7)
NOTE: All example pieces of scientific writing are all tailor made for this lesson and are of the correct reading age for Year 8 students.
Lesson Outcomes:
Describe the key features of effective scientific communication
Describe how to adapt communication for different audiences
This is the last lesson in the Year 8 “Working as a Scientist 2” Topic.
It covers types of evidence, sources of bias in research and evidence, the process of peer-reviewing and what things we should look for when deciding whether evidence (and the conclusions drawn from it) is good.
This lesson is an interactive lesson filled with student activities and participation, including finger voting, class discussions/debates, and mini-whiteboard tasks.
This lesson is designed to be “click and teach” and will require very little planning by the teacher, and with teacher delivery notes and all answers built into the slides it is perfect for non-specialists and those a little uncertain about the lesson content.
Lesson Resources contain:
Lesson powerpoint including class discussions, finger voting AFL tasks, whiteboard AFL tasks, discussion slides, careers links, plenary task, student summary questions, and full answers throughout
Lesson outcomes:
Describe how to assess sources of evidence
Identify possible sources of bias
Describe what a peer-review is
This is the fourth lesson in the Year 8 “Working as a Scientist 2” topic.
This lesson gets students to practice maniplulating data to find means, medians and modes.
This lesson contains AFL whiteboard tasks to assess student understanding in real time, a data collection activity and various opportunities for students to practice calculations.
This lesson resource contains all answers as well as challenge tasks. It is designed to be easy to follow and present, so is great for non-specialist teachers.
Lesson resources:
Lesson powerpoint containing teacher help/instructions in the “notes” section, AFL whiteboard activity, student data collection and manipulation activities, challenge tasks throughout
Lesson objectives:
Describe what a mean, median and mode are
Calculate Mean, Mode and Median for a set of data
For this lesson students will need:
Calculators
This is the third lesson in the Year 8 “Working as a Scientist” topic. This lesson revises what discrete, catagoric and continuous data are, and practices getting students to select the correct graph (bar chart, line graph or pie chart) to use for different examples of data. Students will also practice drawing their own pie charts.
The lesson powerpoint is interactive and packed with quick and easy AFL tasks to help teachers assess the class understanding of content, and can be sped up or slowed down as necessary.
The lesson is complete and is a “click and teach” style lesson that will require little to no prep work for the teacher, so is ideal for those short on time and non-specialist teachers.
This lesson includes:
Teacher powerpoint with full answers built into slides, teacher delivery and hints in “notes” section, worked examples, AFL finger voting activites to assess understanding, answers to student worksheet
Student worksheet (PDF)
Lesson Objectives:
Select the appropriate graph to display data
Present data as a pie chart
For this lesson students will need:
Calculators
Pencils
Protractors
This lesson is taught with the assumption that students have met “types of data” before, but have never drawn pie charts or calculated angles of pie charts.
This lesson is the second lesson in the “Space” topic and covers the structure of our solar system and the composition of the planets within it. The lesson contains various links to online videos, modelling software and simulations that really help students understand the vastness of space and allow them to explore the universe in which we live.
It also addresses the misconception around the distances between selestial objects, gives students the opportunity to describe strenghts and weaknesses in scientific models, and an activity to get students to identify patterns and trends in data about the planets.
This lesson is designed to be easy to teach, student led and is ideal for non-specialist teachers.
This Lesson Contains:
Lesson powerpoint, including activity delivery instructions for teachers, full answers, 3 main student activity tasks to choose from, plenary task, AFL whiteboard task and discussion activities
Student Activity Worksheet and Answer Sheet (PDF) (Main task Option C)
Lesson Objectives:
Describe the structure of our Solar System
Compare position and composition of the planets of the Solar System
Identify trends and patterns in data and draw conclusions
This lesson is the first lesson in the “Space” topic and covers some of the main objects that can be found in the night sky as well as describing our place in the universe. The lesson contains various links to online videos, modelling software and simulations that really help students understand the vastness of space and allow them to explore the universe in which we live.
This Lesson Contains:
Lesson powerpoint, including activity delivery instructions for teachers, full answers, plenary task, AFL whiteboard task and discussion activities
Lesson Objectives:
Describe the objects that you can see in the night sky
Describe the structure of the universe
This lesson is the second lesson in the Year 8 “Working as a Scientist” topic.
This lesson covers what a hazard, risk and control measure are, what some common hazards are in a lab and how to control them, as well as a practical investigation for students to write their own risk assessment.
Lesson Objectives:
State common risks from hazards
Describe how these risks are managed
Write a risk assessment for a scientific investigation
I will work scientifically to:
Carry out a practical investigation safely
Lesson resources contain:
Powerpoint - containing information slides, student mini-whiteboard AFL quiz, complete and interactive answer slides, plenary activity
Student practical worksheet (PDF and editable word versions)
This lesson is the first lesson in the Year 8 “Working as a Scientist” topic.
It covers what accurate and precise data means/looks like, as well as the difference between a prediction and a hypothesis.
This lesson is designed with formative assessment in mind and a large use of hand/finger voting and mini-whiteboards for AFL feedback.
It contains all answers to the tasks and is great for a non-specialist science teacher.
Lesson Objectives:
Write a hypothesis from variables
Describe the difference between accurate and precise
I will work scientifically to:
Identify variables in a practical
Identify data that is accurate and precise
This lesson contains:
Powerpoint - including quizzes to test understanding, student questions to answer, challenge tasks throughout, and full answers. The powerpoint also uses colour-coding to help support AEN and EAL students follow and understand concepts in the lesson.