


Recent
Most read

Recent Tes analysis of government data found 1,673,205 pupils in English schools have special educational needs and disabilities (SEND). ThatŌĆÖs almost a fifth of the school population, and a 31.2 per cent increase since 2016.
The vast majority of these pupils attend mainstream schools. However, a significant number of them are in specialist settings, and it is these children who will typically have the highest levels of need. So, is the system meeting those needs?
Gaps in the data make it difficult to build a complete picture, but Tes has analysed what data there is on specialist provision and teachers to help better understand the situation as it currently stands.
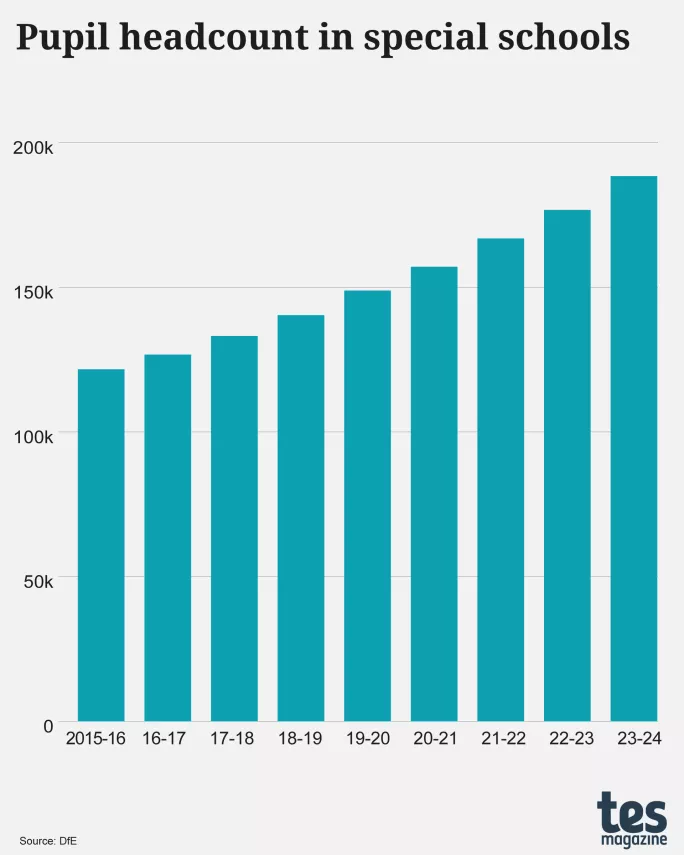
As of 2024, , including state and independent settings. This is an increase of 66,772 pupils from 2016 when 121,654 pupils attended these schools, representing a rise of 54.9 per cent.
╠²
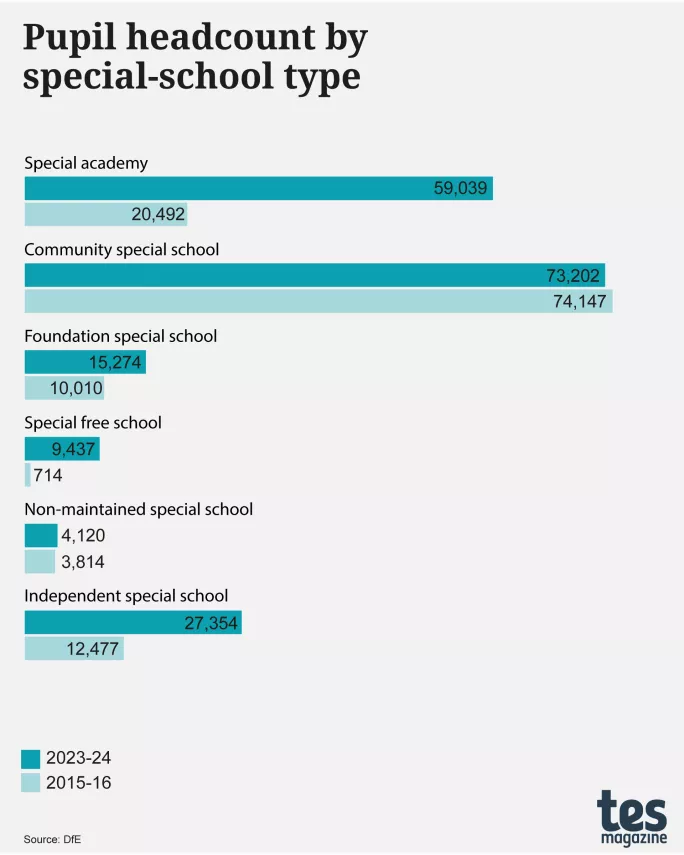
You can see how pupil headcounts have changed according to the type of school since 2016 below. There has been an increase in pupil numbers at all special school types, apart from community (or local-authority-maintained) special schools - likely because of the move towards academisation.
╠²
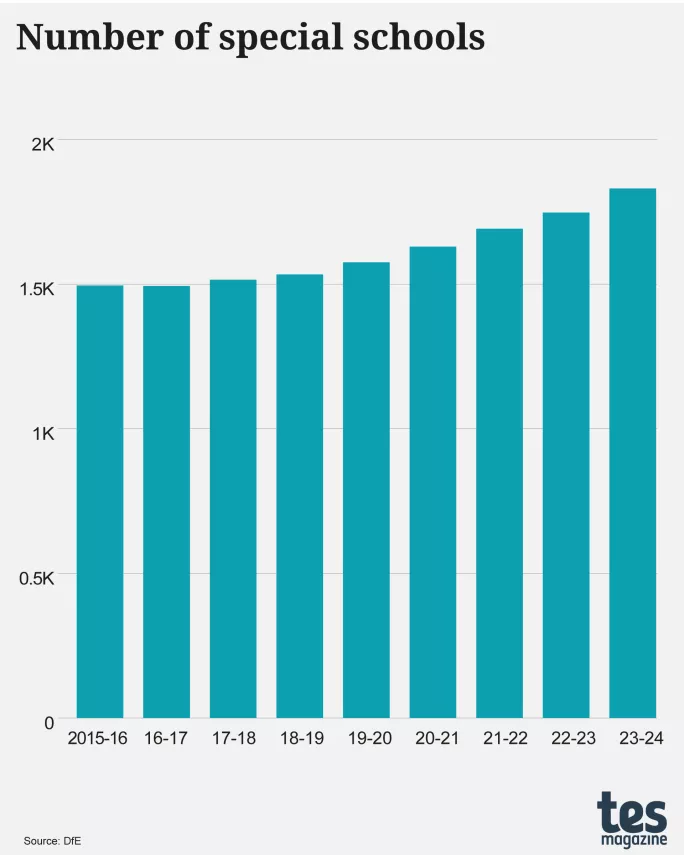
Yet, the 54.9 per cent increase in the pupil population has not been matched in terms of special school numbers.
As of 2024, there are , an increase of 335 compared to 2016, when there were 1,495 schools. This represents a 22.4 per cent rise in special schools - which is less than half of the percentage rise of pupil numbers in special schools.
╠²
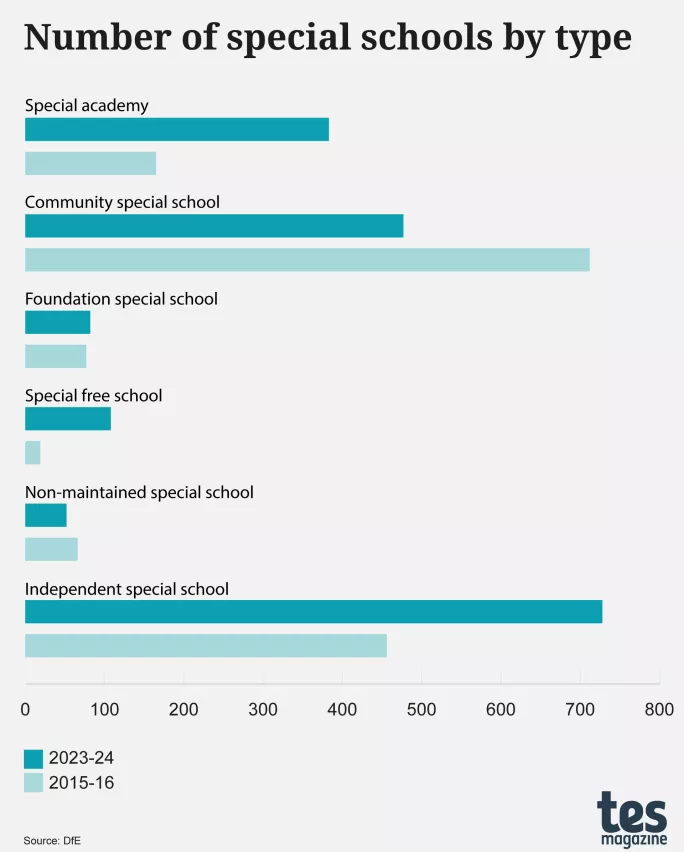
You can see how these special school totals break down by school type below.
╠²
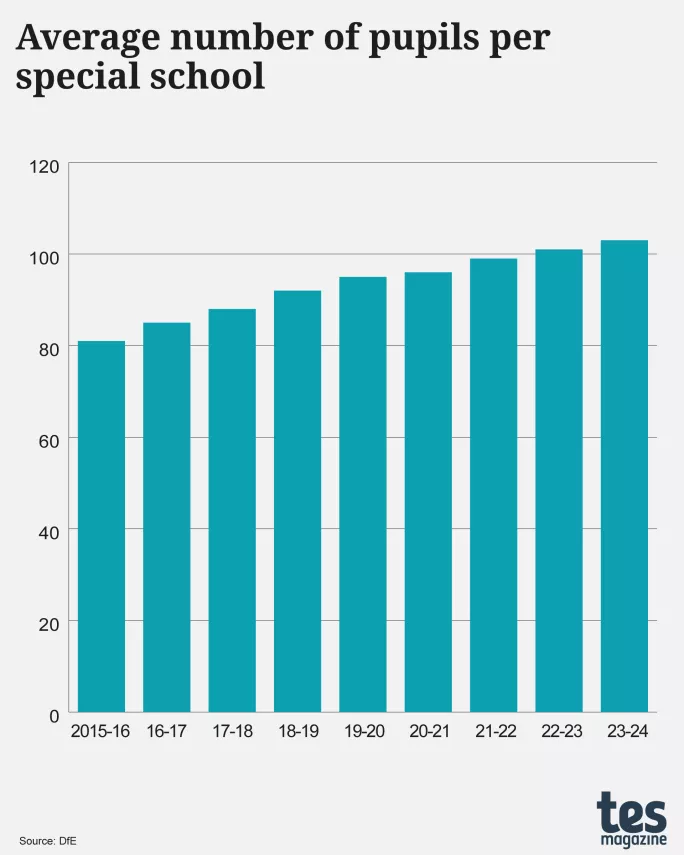
Putting these figures together, we see that, in 2016, there were 121,654 pupils in 1,495 special schools - or an average of 81 pupils per school. As of 2024, there are 188,426 pupils in 1,830 special schools - or an average of 103 pupils per school.
So - assuming the proportion of pupils attending special schools has remained about the same (some pupils with SEND may instead be schooled in other settings, as detailed below) - each special school now has an average of 22 more pupils than it did almost a decade ago.
╠²
This is a problem, says Simon Knight, joint headteacher at the Frank Wise School, a special school in Banbury, explaining that ŌĆ£the increase in pupil populations within schools designed for far fewer children means that too often spaces are being used that are unsuitable for the children being educated within themŌĆØ.
This can also mean ŌĆ£insufficient capacity for meeting personal care needs, accessing breakout spaces and the availability of rooms for subject-specific teachingŌĆØ, he adds. The result is that ŌĆ£everything becomes a compromise in which both children and staff experience a reduction in the quality of experience of being in the schoolŌĆØ.
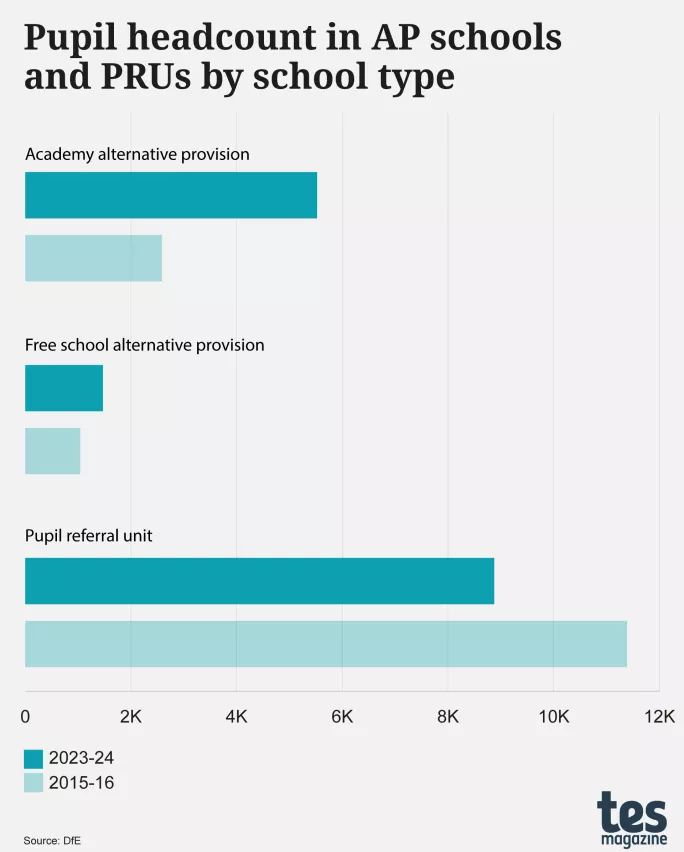
Some pupils with SEND attend alternative provision (AP) schools or pupil referral units (PRUs). ItŌĆÖs worth noting that AP schools can be either LA-maintained or academies, while PRUs are always LA-maintained. Otherwise, the DfE makes no distinction between these school types.
We have separated these numbers from the special school data to acknowledge that not every pupil who attends an AP or PRU has SEND - although these types of provision play an important part in recognising the state of SEND provision as a whole.
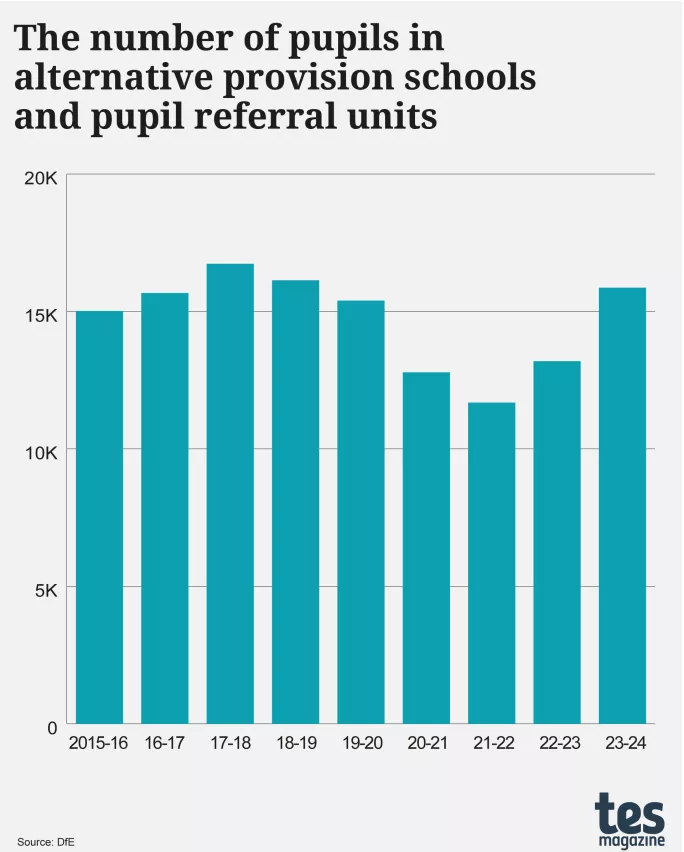
Since 2016, in the number of pupils in AP schools and PRUs - from 15,015 to 15,866.
╠²
You can see how many pupils attend the different types of provision below.
╠²
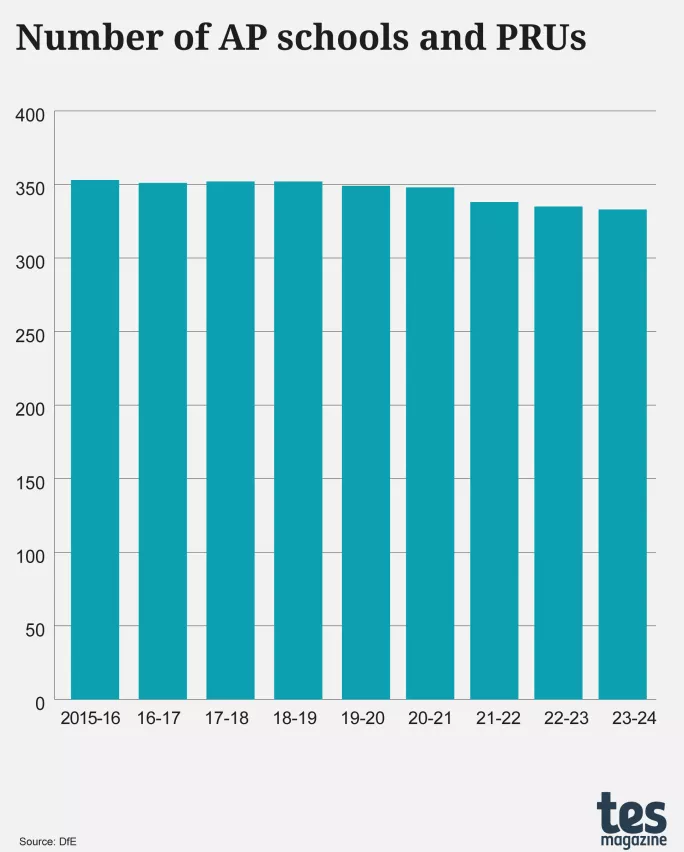
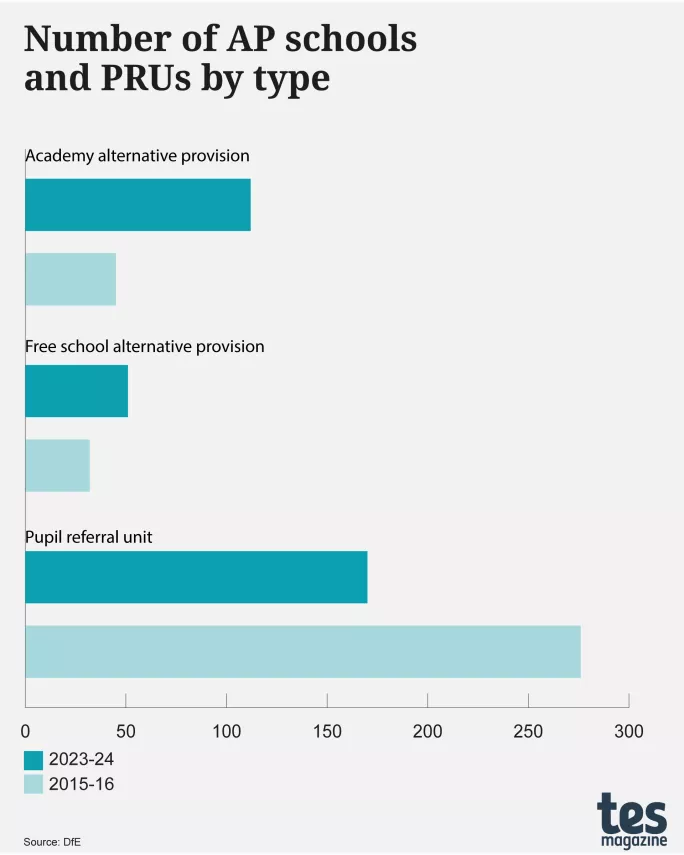
Over the same period, the number of APs and PRUs decreased from 353 in 2016 to 333 in 2024. Overall, those 20 fewer schools represent a decrease of 5.7 per cent.
╠²
You can see how that breaks down by school type in the graph below.
╠²
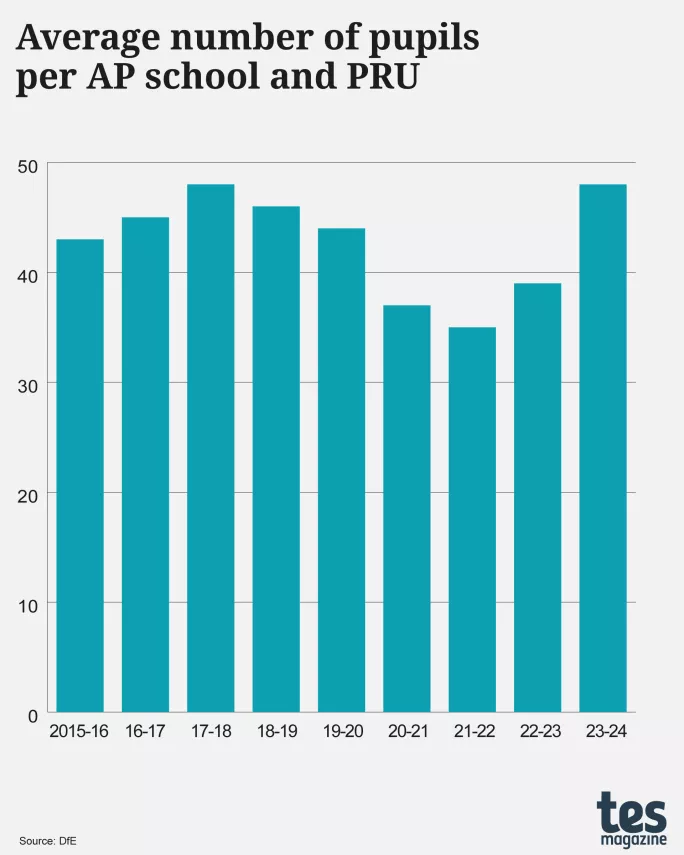
As with special schools, this means there are now more pupils per setting: in 2016, there was an average of 43 pupils per AP or PRU. Now, that number is 48.
╠²
As you can see from the figures above, the number of pupils has increased across all types of specialist SEND settings, while the number of settings has not risen at the same pace.
Clearly, this points towards a capacity problem. This is also evident in the data the DfE collects on capacity - although this data does not cover all school types to show the total extent of the shortfall in places for children with SEND.
And unhelpfully, the DfE only started collecting in 2023 and these are the latest figures available - so we canŌĆÖt yet know exactly how it has improved or worsened over time.
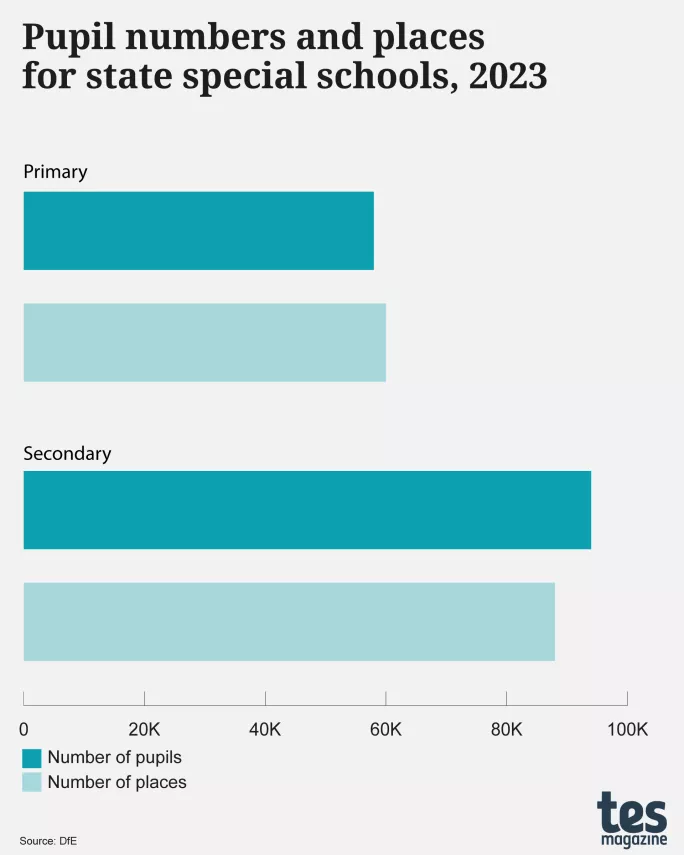
The DfE reports 148,000 state special school places, made up of 60,000 primary and 88,000 secondary.
But the corresponding pupil numbers from 2023 show there were 152,000 pupils in these schools, made up of 58,000 primary and 94,000 secondary. This means there were approximately 4,000 more pupils on roll than special schools have capacity for.
╠²
As an interesting aside, this data also reveals a snapshot of SEND provision within mainstream schools. In SEN units and specialist resource provision (SRP), the government reports capacity at 1,631 - 1,060 at primary, and 571 at secondary.
In terms of places, this breaks down to 9,000 in SEN units (6,000 primary and 3,000 secondary) and 18,000 in SRP (10,000 primary and 8,000 secondary).
But the government doesnŌĆÖt collect pupil numbers for SEN units or SRP - so in terms of shining a light on capacity, these figures arenŌĆÖt helpful.
WhatŌĆÖs more, there is no government data on independent or AP, meaning the data does not offer a complete picture of how the state is faring at creating specialist capacity for all pupils with SEND.
╠²
ŌĆ£We definitely need a better understanding of capacity,ŌĆØ says Margaret Mulholland, SEND and inclusion specialist at the Association of School and College Leaders. ŌĆ£At the moment, weŌĆÖre not in the position to ask all the right questions because we havenŌĆÖt got enough data.ŌĆØ
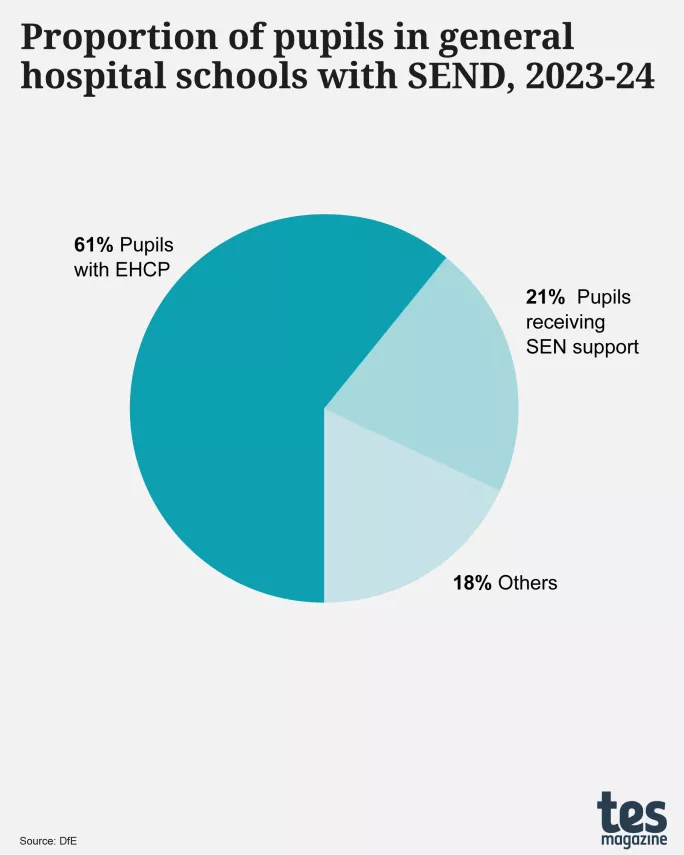
Other children are educated in hospital schools. shows that, as of the 2024 census day, there are 652 children in general hospital schools in England, which is a 57.7 decrease on 2016, when there were 1,540.
Of these, 400 (or 61.3 per cent) have an education, health and care plan (EHCP) and 136 (20.9 per cent) receive SEN support. This means there are a total of 536 pupils with SEND in hospital schools - 82.2 per cent of all pupils in these settings.
╠²
But yet again, this data does not show the full picture, likely accounting for just ŌĆ£a fractionŌĆØ of children in hospital schools, says Cath Kitchen, chair of the National Association for Hospital Education.
ŌĆ£Because of the way in which the data is collected, we actually donŌĆÖt know how many children are educated in hospital schools,ŌĆØ she explains, pointing out that the census only goes to the 12 ŌĆ£designated hospital schoolsŌĆØ, missing out other settings that are formally categorised as medical PRUs, therefore offering only ŌĆ£a very skewed pictureŌĆØ.
Of course, capacity also depends on staffing. So now we are going to look at the number of teachers working in non-mainstream settings.
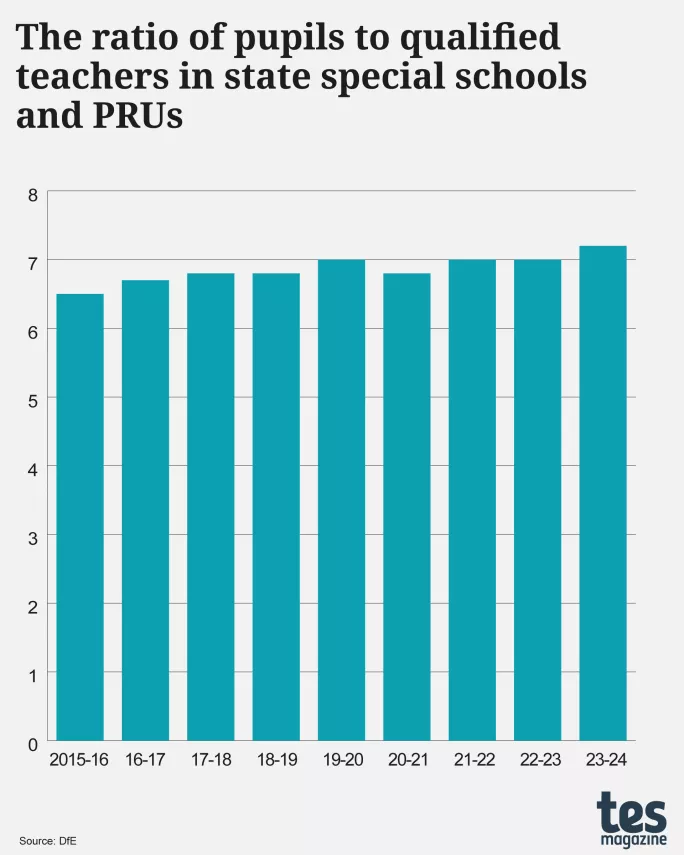
Here, the government data combines special schools and PRUs. The number of qualified teachers working in state-funded special schools and PRUs has increased by 29.8 per cent in recent years, from 19,637 FTE qualified teachers in 2016 to 25,488 in 2024.
But, it hasnŌĆÖt increased as quickly as the pupil population over the same period. So the pupil to qualified teacher ratio has been steadily increasing, from 6.5 in 2016 to 7.1 in 2024 - as shown below.
╠²
This again is a problem, says Knight, explaining ŌĆ£the slow increase in class sizes risks reducing educational quality, operational safety and pupil dignityŌĆØ.
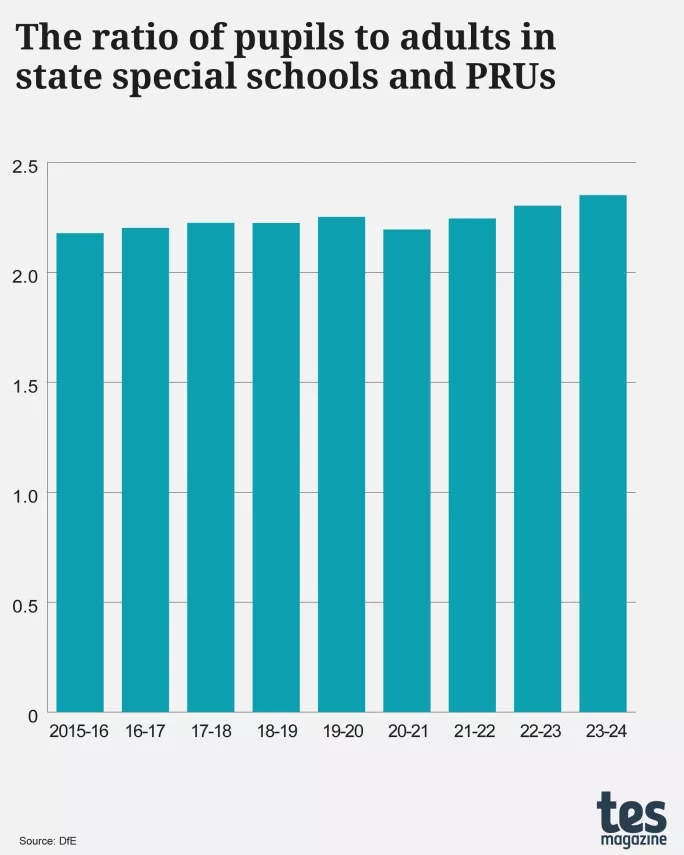
There are, of course, lots more adults working in these settings, including teaching assistants and other support staff.
In 2016, there were 58,907 FTE adults working in state special schools and PRUs. In 2024, that rose to 77,768. But, again, because of the increase in pupil numbers, the pupil to adult ratio has also increased over that period - though less significantly this time, from 2.2 in 2016 to 2.4 at the latest count.
╠²
Finally, letŌĆÖs not forget children who are home-schooled.
The government collects data on (EHE). The most recent report, from autumn 2024, shows there are 111,700 EHE pupils, making up 1.4 per cent of the total number of children aged 5 to 16.
Of course, there are many reasons children may be home-schooled, but those with SEND are represented here: 16 per cent of EHE children had an additional requirement of SEN support (compared to 14 per cent of the overall school population), and 6 per cent had an EHCP (compared to 5 per cent of the school population).
The data offers a breakdown of reasons for EHE, showing that 3 per cent are home-schooled because their parents or carers are dissatisfied with SEND provision in schools.
Meanwhile, a significant 42 per cent of EHE children fall under the ŌĆ£otherŌĆØ, ŌĆ£no reason givenŌĆØ or ŌĆ£unknownŌĆØ categories. Other reasons concerning SEND may well be included here, showing yet another place where there are shortfalls in the data.
The government seems to be aware of this issue, as new duties in the Wellbeing and Schools Bill currently being considered by Parliament will mean parents will need local-authority consent to home-educate if their child is on a child protection plan, at a special school arranged by the council or subject to an enquiry.
This may help lead to better data collection on all EHE children, including those with SEND.
For the latest education news and analysis delivered every weekday morning, sign up for the Tes Daily newsletter