

43Uploads
21k+Views
9k+Downloads
All resources

IB Maths Applications and Interpretation SL: Chapter 8 - Spearman's, Hypothesis Testing, Chi-Squared
This unit contains 5 Powerpoints:
Spearman’s rank
hypothesis testing - chi-squared test of independence
goodness of fit test
goodness of fit - normal and binomial distributions
t-test
Through the PowerPoint there are links to Youtube videos, GeoGebra and Desmos interactive. The PowerPoint has worked examples, and student exercises. I have also put in past paper exam questions for each topic.
I have also included an overall Statistics Test (2 parts short and long questions) and Chi-Squared test of Independence assignment, both with markschemes. As well as a review PowerPoint on the test of Independence. We sent a lot of time on this chapter as the idea was many students would use this for their IA’s, which they did.

IB Maths AI: Voronoi Diagrams
This complete lessons contains Desmos and GeoGebra interactives to demonstrate how to create voronoi diagrams, as well as examples. The lesson starts off with a review on finding equations of perpendicular bisectors then moves into a explorative task about voronoi diagrams. The lessons covers the following topics:
equation of a perpendicular bisector
how to construct a perpendicular bisector
key terminology used when constructing voronoi diagrams
how to construct a voronoi diagram with multiple sites
finidng centre of a circle using perpendicular bisectors of cords
finding locations of missing sites
nearest neighbour
adding new sites to a voronoi diagram
toxic waste dump problems (largest circle)
At the end this is a multiple choice quiz. There are also embedded link to Desmos Classroom activities. As well, throughout the PowerPoint there are worked examples and exercises and past paper exam questions for students to complete.

IB Maths Applications and Interpretation SL: Chapter 11 - Trigonometric Functions
This unit contains a Powerpoint which goes through the following:
-periodic functions
-sine, cosine, and tangent curves
-transformations of sinusoidal functions
-sketching
-finding equations
-modeling questions
Through the PowerPoint there are links to Youtube videos, GeoGebra and Desmos interactives. The PowerPoint has worked examples, and student exercises. I have also put in past paper exam questions for each topic.

IB Maths Applications and Interpretation SL: Chapter 9 - Power Functions
There are 2 PowerPoints for this unit:
Quadratics and Cubics
Optimization without Calculus
PowerPoint 1 goes through:
-domain and range (recap)
-intercepts
-power functions
-3 forms of a quadratic
-axis of symmetry
-modeling
-finding equations of functions
-inverse functions (recap)
Through the PowerPoint there are links to Youtube videos, GeoGebra and Desmos interactives. The PowerPoints have worked examples, and student exercises. I have also put in past paper exam questions for each topic.

IB Maths Applications and Interpretation SL: Chapter 7 - Probability, Binomial/Normal Distributions
The following contains 5 PowerPoints:
Introduction to Probability
Venn Diagrams
Probability DIstributions
Normal DIstributions
Binomial DIstributions
Through the PowerPoint there are links to Youtube videos, GeoGebra and Desmos interactives. The PowerPoint has worked examples, and student exercises. I have also put in past paper exam questions for each topic.
I have also included a Normal Distibution Review PPT and assignment with markscheme.

IB Maths Applications and Interpretation SL: Chapter 12 - Differential Calculus
This unit contains 2 Powerpoints:
Differentiation
Optimisation
Through the PowerPoint there are links to Youtube videos, GeoGebra and Desmos interactives. The PowerPoint has worked examples, and student exercises. I have also put in past paper exam questions for each topic.
I have also included a worksheet with solutions.

IB Maths Applications and Interpretation SL: Chapter 13 - Integration
This unit contains 2 Powerpoints:
Integration
Trapezium Rule
Through the PowerPoint there are links to Youtube videos, GeoGebra and Desmos interactives. The PowerPoint has worked examples, and student exercises. I have also put in past paper exam questions for each topic.
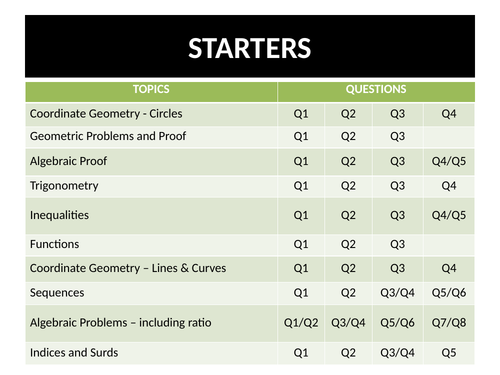
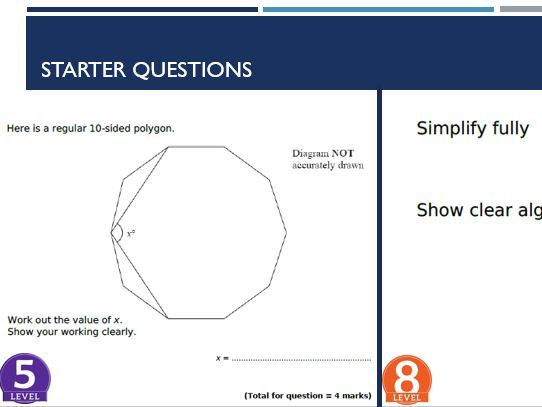
GCSE 9-1 Maths Higher Level Starters (Target 8-9)
The following starter questions are for students targeting grades 7-9. Questions are taken from various exam boards and include solutions. Encourages students to think and apply their skills in different contexts. Entire PowerPoint includes over 50 questions in the following categories:
Coordinate Geometry - Circles
Geometric Problems and Proof
Algebraic Proof
Trigonometry
Inequalities
Functions
Coordinate Geometry – Lines & Curves
Sequences
Algebraic Problems – including ratio
Indices and Surds
Statistics
Extra

IB Maths Applications and Interpretation SL: Statistics - Data Collection & One Variable Analysis
The following four presentation was created for the Applications and Interpretations SL course following the order of teaching for the Kognity textbook but can also be used with the Pearson or Oxford textbook.
The following PowerPoints go through the following:
Introduction to Statistics
-types of data - qualitative and quantitative
-types of data - discrete and continuous
-collecting data - primary and secondary
-population, sample, census
-choosing a good sample - sampling frame, sampling unit, etc.
-sampling bias
-reliability vs validity
-questionnaires
-what makes a good survey - eg. biased questions, vague questions, leading questions, etc.
Sampling Techniques
-types of sampling - simple random, stratified, systematic, voluntary, convenience, and quota
-pros and cons for each
**Measures of Central Tendency **
-mean, median and mode
-skewed data
-difference between population mean and sample mean
-grouped and un-grouped data
-how to use GDC
-outliers
-effect of outliers on mean and median
-combined mean
Measures of Spread
-Range, IQR, variance, and standard deviation
-lower quartile and upper quartile
-how to use GDC
-difference between population and sample standard deviation
-effects of SD on normal distribution curve
-normal distribution curve
*transformation of data
*outliers using mean and SD
Throughout the PowerPoint there are worked examples along with exercises for students. I have also included a few Desmos and Geogebra interactive links to help students get a better understanding of the concepts through visuals. At the end of each section I have included IB exam questions so students get get practice to the types and style of questioning they should expect to see when they write their exams. I also have included a few thinking questions, a few taken from A Level maths exams. There are also links to YouTube videos to help students understanding with certain content.

IB Maths Applications and Interpretation SL: Jeopardy Revision Game
The following activity is a great way to spend last couple days revising.
The game has all the music and sounds like the real game.

IB Maths Applications and Interpretation SL: Optimisation
The following lesson goes through the following:
-Optimisation without calculus
-The second derivative
-Optimisation with calculus
The lesson contains worked examples along with IB practice problems.

IB Maths Applications and Interpretation SL: Financial Mathematics
The following contains 4 PowerPoints covering the following topics:
Simple Interest
Compound Interest
Inflation
Depreciation
Loans
Annuities
Amortization
Each PowerPoint contains worked examples, student exercises and Past Exam questions. There are also links throughout to various YouTube explanations (eg. difference between simple interest and compound interest, what is amortization?, etc.), How to use the GDC examples, Desmos, and Geogebra interactives.

IB Maths Applications and Interpretation SL: Chapter 4 - Dividing Up Space
The PowerPoint follows chapter 4 from the Oxford textbook. There are worked examples, student exercises and past paper exam questions for each section. I have also embedded links to various Youtube, GeoGebra and Desmos activities and visuals to help improve student understanding. The PowerPoint contains the following content:
recap piecewise functions
the number plane
distance between 2 points (2D & 3D)
midpoint (2D & 3D)
classifying triangles given coordinates
coordinate geometry in 3D space
gradients
different forms of an equation of a line
points of intersection
parallel and perpendicular lines
collinear points
perpendicular bisectors
shortest distance to a line

IB Maths Applications and Interpretation SL: Chapter 5 - Modelling Constant Rates of Change
The following PowerPoint covers the following topics following the Oxford textbook. Topics covered include:
Functions
* reation
* domain and range
* mapping diagrams
* number system
* set notation
* interval notation
* what is a function
* vertical line test
* function notation (numerical, graphical, and algebraic)
* finding equation of functions from a mapping diagram
Linear Models
* recap equation of a line
* rates of change
* simultaneous equations
* direct proportion
* inverse functions
* domain and range
* horizontal line test (one-to-one)
* finding inverse functions
Arithmetic Sequences
Arithmetic Series
* sigma notation
Simple interest
Modelling
Through the PowerPoint there are links to youtube videos, GeoGebra and Desmos interactives, and Desmos Classroom activities. The PowerPoint has worked examples, and student exercises. I have also put in past paper exam questions for each topic.

IB Maths: Applications and Interpretation SL - Exponential and Logarithmic Functions
Complete PowerPoints for Chapter 10 - Modelling Rates of Change: Exponential and Logarithmic Functions, for the Oxford textbook. The PowerPowers can be used with other textbooks. PowerPoints are built around students learning the the following topics online, but can also be used to deliver in-class. PowerPoints have embedded links to video examples, Desmos activities, GeoGebra, and Casio GDC videos. The following is the topics that the 8 PowerPoints cover.
Geometric Sequences
Geometric Series
Compound Interest
Annuities
Amortization
Exponential Functions
Exponential Models
Exponential & Logarithmic Equations
There are also Past Paper questions in each section of the unit.
GCSE 9-1 Maths Starters (Target Grades 4-6)
20 Maths starters for targeting grades 4 - 6 on a Higher Paper. Also works well if teaching a boarder line class with a few students writing the Foundation Exam. Most starters have complete solutions. Questions are taken from various Edexcel Exam papers and contains questions from levels 4 - 9. Certain higher level questions are given for students to transfer their skills and obtain some of the marks.
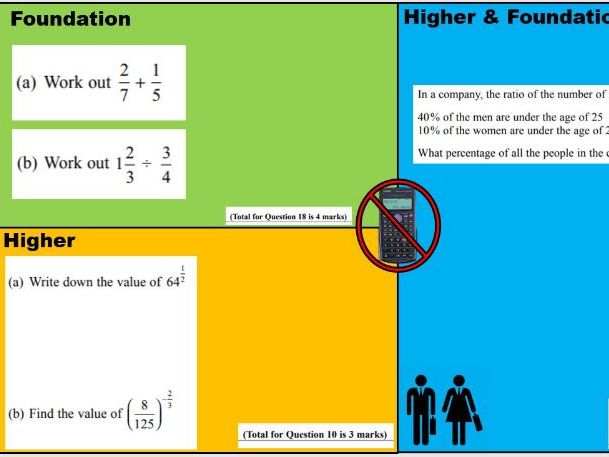
Higher GCSE Maths Starters (Target 5 - 9)
Th bundle contains 32 days worth of starters. Each stater comprises of 2 questions. One being of level 4 or 5 and the other of level 7 to 9. The idea is that students will practice both questions from the beginning and ending of the exam. I find higher level students tend to make mistakes early of in the exam and this allows them to practice these types of questions in class. Thus helping to improve results.

Time Series Assignment
Here is a short independent task looking at time series of population over time. It also creates discussion for curves of best fit.

IB Maths Analysis and Approaches SL: Quadratic Inequalities
I used this lesson before going into the quadratic formula and the discriminant.
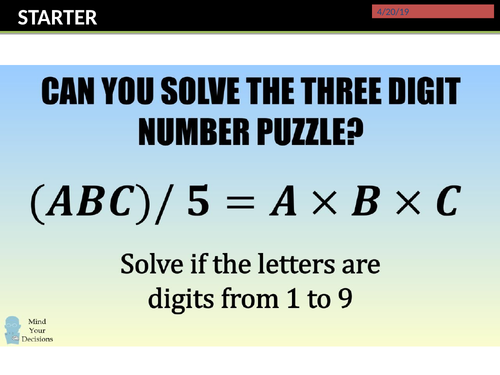
GCSE 9-1 Maths Digit Proofs
For those higher achieving students looking to get a grade 9. As proofs is new to the Edexcel specification, digit proofs is not common but has shown up on a Mock Exam.