I create mathematics powerpoint and other resources for Key Stages 1, 2, 3 & 4, which are designed to clearly explain topics. These can be presented by the teacher, or accessed by individual students.
I can create bespoke resources.
Most KS2 and KS4 Maths Topics are in Bundles, as are the KS1 Powerpoint Mental Starters, or available separately If you'd like a bespoke bundle, please tell me the items you would like in it, and I will do this, at a discount of about 30% off total price.
A bright and colourful Powerpoint to explain Bar Charts, plus a two sided A4 pdf worksheet. This powerpoint has 18 slides (Plus one title and one end slide). Designed for KS2. The powerpoint covers bar charts with vertical bars and also with horizontal bars.
The worksheet, “Rainfall Bar Charts” has a bar chart on side 1 with 10 questions, and pupils are asked to draw another bar chart on side 2 and answer 10 more questions about this.
Revised 23 May 2020
Escape from Addingham Hall
This is a fantastic new Escape Room. Aimed at Years 6 and 7, but could also be used with other year groups. Ideal for use at any time in your teaching, or as an end of term activity. This would also be a useful activity in a Maths Day or Year 6 transition day.
Each of the Six Rooms in Addingham Hall contains a maths problem/puzzle.
The skills required to solve the problems are:
Room 1: Finding and adding Prime Numbers under 100.
Room 2: Adding 100 numbers under 100 (looking for patterns).
Room 3: Addition.
Room 4: Completing Magic Square.
Room 5: Solving a number problem.
Room 6: Calculating the Mean Average.
You are provided with the following three files:
A Powerpoint Show which pupils use throughout the activity.
A Teacher Powerpoint to introduce the activity, and go through all the answers at the end.
A PDF containing instructions, fill in sheets for pupils (should you choose to use these), and full answers.
This is a full lesson which your students will enjoy.
A Powerpoint looking at Line Graphs. plus a two sided A4 PDF worksheet.
The powerpoint has 14 slides (Plus one title and one end slide).
There are four examples looking at how to draw line graphs, followed by 10 example questions based on the 4th Line graph drawn.
The worksheet has two questions involving drawing line graphs from a given table of data, and a third question has 10 individual questions to be answered based on a given line graph.
Designed for KS2.
Fully Up to Date.
A Powerpoint to explain Time. This powerpoint has 48 slides (Plus one title and one end slide). Designed for KS2.
Topics covered are:
Connection Between Times
Telling the Time
Finding the Gap Between Two Times
Revised on 11 Jun 2020
Pythagoras for KS3 Maths
This individual powerpoint presentation is from the KS3 Maths Topics Series.
It contains 53 slides (Plus a title and end slide), so there are lots of examples. Two different methods of setting the working our are used.
This is an ideal resource which you will enjoy using to explain Pythagoras’ Theorem to your classes for years to come.
The powerpoint explains:
Pythagoras’ Theorem: Introduction
Pythagoras’ Theorem
Finding the Longest Side: Method 1
Finding one of the Shorter Sides: Method 1
Various Questions: Method 1
Finding the Longest Side: Method 2
Finding one of the Shorter Sides: Method 2
Various Questions: Method 2
15 Powerpoint Presentations from the KS3 Powerpoint Mental Starters for Cross Curricular Numeracy Series. These are designed to practice and promote numeracy in Geography.
Each of the powerpoints has 20 questions, and each question is followed by the answer. These are ideal as a lesson starter, or could be used at any point during a lesson.
They are available at this introductory price for a short time only.
Topics are:
Compass Directions
Converting Metric Units
Distance Chart
European Flag Ratios
European Temperature Data
Following Directions
Land Area Approximations
Land Use Bar Charts
Land Use Pie Charts
Map Scales
Mountain Height Differences
Numbers from Facts
Six Figure Grid References
Temperature and Rainfall Graphs
UK Population Differences
A Powerpoint to explain Pictograms. This powerpoint has 20 slides (Plus one title and one end slide). Designed for KS2.
4 different pictograms are used in the examples.
The new design has three more questions that the older version (which is also included)
Factors, Multiples and Primes for KS3
This individual powerpoint presentation is from the KS3 Maths Topics Series.
It contains 54 slides (Plus a title and end slide), so there are lots of examples. This is an ideal resource which you will enjoy using to explain Facotrs, Multiples and Primes to your classes for years to come.
The powerpoint explains:
Prime Numbers & Finding Prime Numbers
Factors
Common Factor
Highest Common Factor
Multiples
Common Multiple
Lowest Common Multiple
Writing a Number as a Product of Prime Factors
A Powerpoint to explain Types of Data. This powerpoint has 18 slides (Including one title and one end slide). Designed for KS4 / GCSE.
This covers:
Qualitative and Quantitative Data
Discrete and Continuous Data
Also included is a one sided A4 pdf worksheet, containing 15 questions where pupils have to tick the relevant box to indicate the type of data given. Answers are also given.
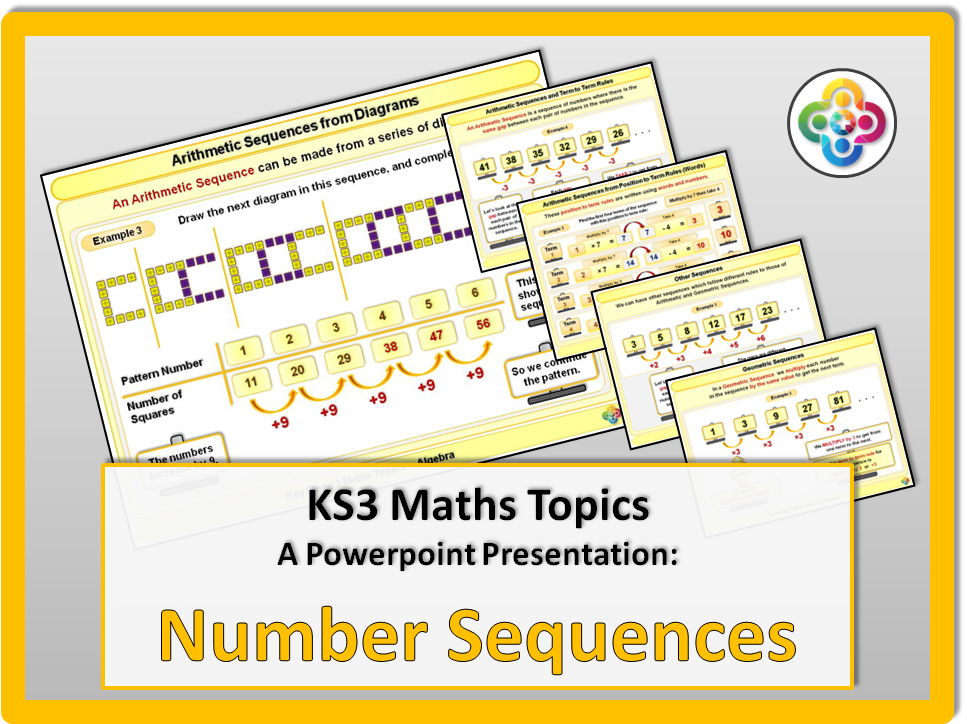
Number Sequences KS3
This individual powerpoint presentation is from the KS3 Maths Topics Series.
It contains 51 slides (Plus a title and end slide), so there are lots of examples. This is an ideal resource which you will enjoy using to explain Number Sequences to your classes for years to come.
The powerpoint explains:
Number Sequences
Arithmetic Sequences and Term to Term Rules
Arithmetic Sequences from Diagrams
Arithmetic Sequences from Position to Term Rules (Words)
Arithmetic Sequences from Position to Term Rules (Letters)
Finding the Rule for an Arithmetic Sequence
Drawing Graphs of Arithmetic Sequences
Geometric Sequences
Other Sequences
Read less
A short Powerpoint looking at Misleading Statistical Graphs. This powerpoint has 6 slides (Plus one title and one end slide). Designed for KS2.
Modified on 10 Jun 2020 to include two additional examples.
There are now two examples of bar charts, two example of line graphs and an example of a different chart.
A Powerpoint to explain how to read a train timetable. This powerpoint has 22 slides (Plus one title and one end slide). Three different timetables are used in the examples. Designed for KS2.
Also included is an A4 worksheet with 12 questions plus answers.
I’ve also added the new powerpoint using different title slides and slightly modified layout.
A Powerpoint to explain how to find Best Value for Money. This powerpoint has 8 slides (Plus one title and one end slide), so there are five examples in total. Designed for KS2.
Also included is a two sided A4 PDF worksheet, containing 12 questions. Full answers are also provided
Both the original powerpoint and the newly designed one are included
A Powerpoint to explain Pie Charts. The new powerpoint has 15 slides (Including one title and one end slide). Designed for KS2.
This covers:
Introducing Pie Charts
Values from Pie Charts
Drawing Pie Charts
The original powerpoint is also included.
A Powerpoint to explain Cubic and Reciprocal Graphs. This powerpoint has 23 slides (Including one title and one end slide). Designed for KS4 / GCSE.
Topics covered are:
Cubic Graphs
Shape of Cubic Graphs
Drawing Cubic Graphs
Reciprocal Graphs
Shape of Reciprocal Graphs
Drawing Reciprocal Graphs
A Powerpoint to explain Area of quadrilaterals. This powerpoint has 10 slides (Including one title and one end slide). Designed for KS4 / GCSE.
Topics included:
Area of a Rectangle
Area of a Parallelogram
Area of a Trapezium
Area of a Kite
A Powerpoint to explain how to calculate Best Value for Money. This powerpoint has 13 slides (Including one title and one end slide). Designed for KS4 / GCSE.
Two methods are examined.
A bright and stimulating Powerpoint to explain Negative Numbers. This powerpoint has 12 slides (Plus one title and one end slide). Designed for KS2.
The topics in the powerpoint are:
Negative Numbers
Negative Numbers: A Number Line
Putting Negative Numbers in the Correct Order
Adding and Subtracting Negative Numbers
Both the original powerpoint, and the new one (with new title and end slides) are included.
A Powerpoint to explain Ratio and Proportion. This powerpoint has 33 slides (Plus one title and one end slide). Also there are three Ratio worksheets. Designed for KS2.
Topics covered in the powerpoint are:
Introducing Ratios
Simplifying Ratios
Solving Problems with Ratios
Introducing Proportion
Solving Problems with Proportions
Amended on 29 May 2020