All my resources have been created to use with classes I teach. Often I've created resources because, for a particular topic, I haven't been happy with the number/standard of the examples in a textbook. Sometimes I've created worksheets for certain topics (e.g. graph transformations) because I feel my classes will make greater progress on a printed worksheet than trying to work from a textbook. I always aim to produce high-quality resources that improve the students' learning and understanding.
All my resources have been created to use with classes I teach. Often I've created resources because, for a particular topic, I haven't been happy with the number/standard of the examples in a textbook. Sometimes I've created worksheets for certain topics (e.g. graph transformations) because I feel my classes will make greater progress on a printed worksheet than trying to work from a textbook. I always aim to produce high-quality resources that improve the students' learning and understanding.
This short worksheet can be used to deliver the topic of proof by contradiction in the new A level specification for all exam boards. A useful resource to help deliver this new topic - fully worked solutions are included for all examples and questions in the exercise.
It begins with 5 examples to work through with your class (the full proofs are given in the teacher’s version). The examples are carefully chosen so that, for the final example, students have seen the results/techniques they need to prove that the square root of 5 is irrational.
Students are expected to be familiar with a proof of the infinity of primes, so on the next page this proof is given in full, together with some numerical examples that should help students understand part of its argument.
There is then an exercise with 9 questions for students to attempt themselves (full proofs provided).
A homework/test is also included (7 questions), with fully-worked solutions provided.
Here is an example of one of my A level resources that is freely available:
/teaching-resource/differentiation-and-integration-with-exponential-and-trigonometric-functions-new-a-level-11981186
I think this is a difficult topic to teach well from a textbook. These printable worksheets have helped my classes make faster progress and gain a better understanding within the lesson.
The resources are suitable for the new GCSE specification which does not include stretches of graphs.
These resources cover all the required knowledge for the statistics element of the new AS level papers.
For each topic there are detailed notes, examples, exercises (with answers) and an assessment with fully worked solutions.
Please see the individual resources for more details.
These resources cover all the required knowledge and skills for differentiation and integration at AS level for the new A level.
Each resource contains teaching notes, examples, exercises (with solutions) and an assessment that can be used as a homework or a test.
Please see the individual resources for more details.
These resources cover all the required knowledge for the statistics element of the new A2 level papers.
For each topic there are detailed notes, examples, exercises (with answers) and an assessment with fully worked solutions.
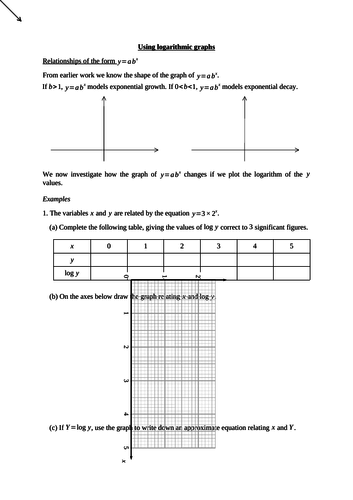
This resource was designed to help students learn how graphs with logarithmic scales are connected to models of the form y=ab^x and y=ax^n.
The first section focuses on models of the form y=ab^x. There are examples to work through as a class, with axes provided, to establish that if y=ab^x then there is a linear relationship between log(y) and x. There is then a page of examples to practice changing from y=ab^x into the linear equation, and vice versa. The examples conclude with 2 questions where students are given experimental data and required to use a graph to estimate the values of a and b in the model y=ab^x - which is typical of an examination-style question.
There is then an exercise with 11 questions for students to complete on their own (again, all axes are provided).
The second section focuses on models of the form y=ax^n. There are examples to work through as a class, with axes provided, to establish that if y=ax^n then there is a linear relationship between log(y) and log(x). There is then a page of examples to practice changing from y=ax^n into the linear equation, and vice versa. The examples conclude with 2 questions where students are given experimental data and required to use a graph to estimate the values of a and n in the model y=ax^n - which is typical of an examination-style question.
There is then an exercise with 11 questions for students to complete on their own (again, all axes are provided).
Answers to all questions in the exercises are included.
Here is an example of one of my A level resources that is freely available:
/teaching-resource/differentiation-and-integration-with-exponential-and-trigonometric-functions-new-a-level-11981186
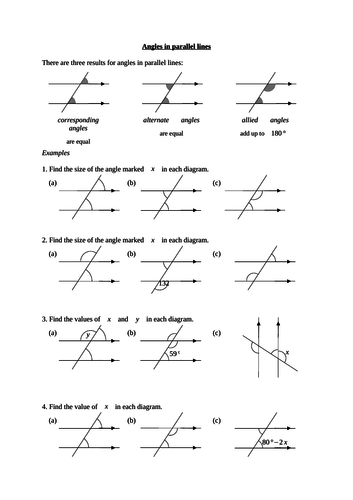
This simple worksheet is a good way to introduce/review angles in parallel lines.
It begins with diagrams of corresponding, alternate and allied (supplementary) angles, then there are some examples to work through with your class.
On the second page there is a short exercise with similar problems for the class to do themselves.
Answers to the exercise are included.
The presentation introduces the idea of drawing a graph to represent how quickly a container fills with liquid over time. The print-version can be given to pupils to make notes on and complete as the presentation is shown.
The worksheet is designed to test their understanding after completing the presentation (answers are included).
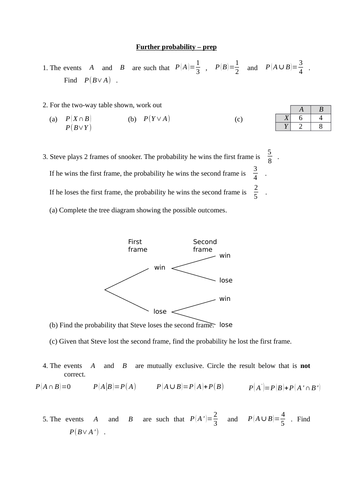
This 21-page resource covers all the required knowledge for conditional probability in the A2 part of the new A level. In every section it contains examples to work through with your class followed by an exercise of questions for students to attempt themselves (answers included).
The sections are:
Venn diagrams and set notation (revision of AS level work)
Conditional probability using Venn diagrams
Conditional probability using two-way tables
Conditional probability using tree diagrams
This projectable and printable resource will save you having to draw any tables/diagrams when teaching the topic and will make things easier for your students as they can just work directly on the provided tables and diagrams.
The 2 page assessment covers all aspects of the topic and fully worked solutions are provided.
Here is an example of one of my A level resources that is freely available:
/teaching-resource/differentiation-and-integration-with-exponential-and-trigonometric-functions-new-a-level-11981186
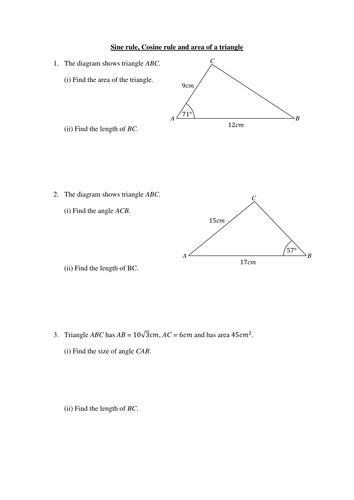
This simple 2-sided worksheet can be used with your class as practice or revision of trigonometry in non right-angled triangles. The answers are included but can be removed if you want to use the sheet as a homework or test.
Note that one of the questions involves bearings.
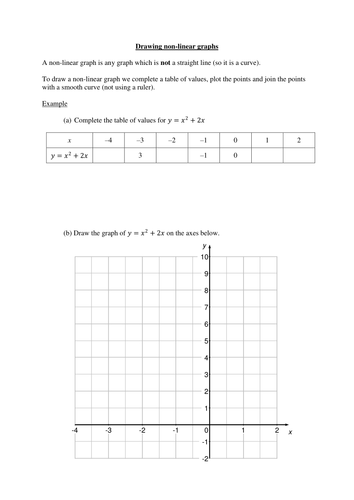
The first two resources are 2 different worksheets that can be used to get your class to learn the different types of graph they are expected to be familiar with at GCSE (linear, quadratic, cubic, reciprocal, exponential and square root) and to be able to recognise or sketch them.
The first resource gets them to calculate points, plot them and join them up, while the second resource was designed to use Geogebra, but would suit any graphing software. In my experience students need a fair bit of time to complete these so this activity may well fill your entire lesson.
The third resource is a worksheet to check their knowledge after completing one of the earlier activities (solutions included).
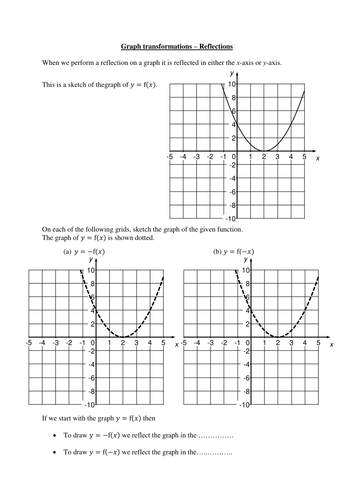
I've always thought that graph transformations is a difficult topic to teach well from a textbook, that's the reason I created these worksheets so my classes could practise sketching the transformations without having to draw axes or try to copy the original curve.
This worksheet has examples and an exercise which focuses on reflections but some questions also involve translations.
The examples are designed to work through as a class and then the rules for the different reflections can be completed.
There are 7 pages of questions for students to complete, including sketching the transformed graph and stating the equation of a transformed graph.
All answers are included - I usually project these so that the whole class can check their answers.
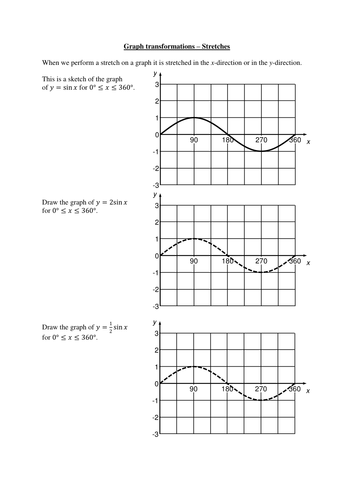
I've always thought that graph transformations is a difficult topic to teach well from a textbook, that's the reason I created these worksheets so my classes could practise sketching the transformations without having to draw axes or try to copy the original curve.
This worksheet has examples and an exercise on stretches.
The examples are designed to work through as a class and then the rules for the different stretches can be completed.
There are 6 pages of questions for students to complete, including sketching the stretched graph, stating the equation of a stretched graph and stating the new coordinates of a point on the original graph.
All answers are included - I usually project these so that the whole class can check their answers.
Please note this topic is not in the new GCSE spec.
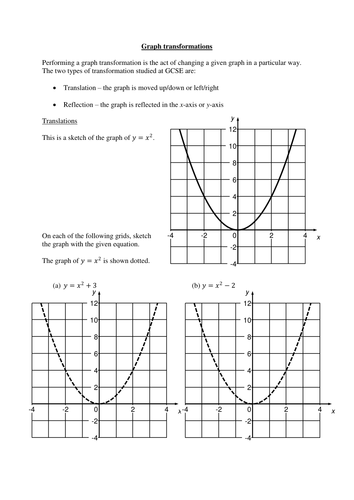
I've always thought that graph transformations is a difficult topic to teach well from a textbook, that's the reason I created these worksheets so my classes could practise sketching the transformations without having to draw axes or try to copy the original curve.
This worksheet introduces the topic of graph transformations and then has examples and an exercise on translations.
The examples are designed to work through as a class and then the rules for the different translations can be completed.
There are 6 pages of questions for students to complete, including sketching the translated graph and stating the equation of a translated graph.
All answers are included - I usually project these so that the whole class can check their answers.
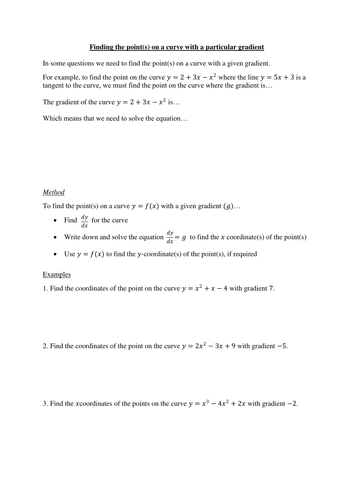
The first worksheet introduces the method for finding the point(s) on a curve with a particular gradient. There are a few examples to work through as a class and then 16 questions for students to attempt.
The second worksheet focuses on finding stationary points. Again, it explains the method, has a few examples to work through as a class and then 20 questions for students to complete. The worksheet then has a section that can be used to explain how to determine the nature of a stationary point by considering the gradient of the curve just before/after the point. There are some examples to do as a class and then 8 questions for students to complete.
The final worksheet can be used to explain and practise using the second derivative for determining the nature of stationary points.
Answers to all exercises are included.
Note that this resource was designed specifically for the Level 2 Further Maths qualification, so only covers differentiating functions with positive integer powers such as y=5x^3-4x+2, but can still be used an introduction to the general method of finding stationary points on a curve.
These 2 resources cover all the required knowledge and techniques for the topic of vectors, as required for AS part of the new A level. In each section it contains notes, explanations and examples to work through with your class followed by an exercise of questions for students to attempt themselves (answers included).
The first resource is a 36-page booklet which covers the following:
1.Vector basics - translations, magnitude, unit vectors, angle between vectors
2.Parallel vectors and vector addition
3.Displacement and position vectors
4.Using vectors with points on a line (midpoints, check collinear, ratios)
5.Geometrical problems using vectors
The second resource is an 18-question assessment that can be used as a homework or test. Fully worked solutions to this assessment are provided.
Note - this does not cover the use of vectors in mechanics questions, only their application in pure maths.
This projectable and printable resource will save you having to create or write out any notes/examples when teaching the topic, and will make things easier for your students as they can just work directly on the given spaces provided for solutions. The comprehensive set of exercises contains around 100 questions for your students to complete. Answers to all exercises are included.
Here is an example of one of my A level resources that is freely available:
/teaching-resource/differentiation-and-integration-with-exponential-and-trigonometric-functions-new-a-level-11981186
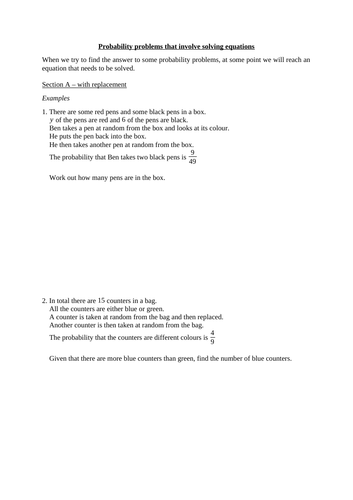
These resources deal with problems where 2 or more items are chosen at random, we are given the probability of a particular outcome, and this is used to derive a quadratic equation that then needs to be solved.
The first resource can be used to teach the topic. It is in two sections - section A deals with selection with replacement, section B deals with selection without replacement. In each section there are 2 examples to work through with the class, followed by an exercise with more than 10 questions of increasing difficulty for the class to attempt themselves. Fully worked solutions to the examples and exercises are included.
The second resource is another set of questions that can be used as a homework or revision - 8 questions that are a mixture of with/without replacement.
Also included is a spreadsheet that calculates the probabilities for all outcomes in situations where there are between 5 and 40 items - just in case your class loves this topic and wants more questions!