

57Uploads
35k+Views
26k+Downloads
All resources

Higher Apps of Maths 2025 data booklet questions
There is no guarantee these are the questions that will be asked.
The purpose of this task is to get pupils used to reading the data booklet and thinking about the information presented.
Credit to “@clellandmaths” for the csv file.
EDIT: Note there is a wee typo in the spreadsheet (“CO2” heading in the table should read “mass (g)”).

Increasingly difficult "Goat on a rope" problems aka loci and areas
Find the area of grass the goat can graze on.
Most areas are based on half and quarter circles.
Sheet looks rough and ready but I’m quite pleased with the set of questions.
Final question is based on an NRich task.
Answers included.
Aimed at a Scottish SQA N5 Applications class.

Optimization - scaffolded problems
Something pupils traditionally find difficult. All context stripped away and problems laid out in a structured grid. Handwritten solutions included.

Increasingly Difficult Exercise: Equation of a Cirlce (SQA Higher Maths)
An set of questions that gets increasingly difficult with each subsequent question. Covers course content for SQA (Scottish) Higher. This task was uploaded to Chris McGrane’s starting points website a few years back. I’ve uploaded it here with a handwritten set of solutions.
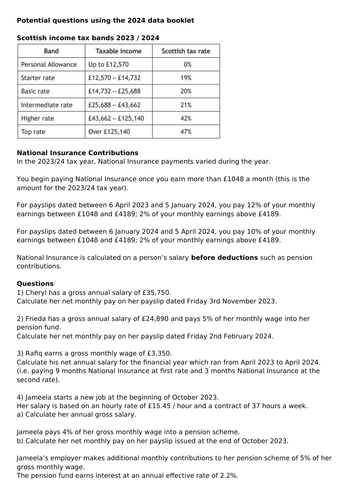
Higher Applications of Maths - varying National Insurance rates
A handful of questions based on the National Insurance rates given in the 2024 data booklet.

Statistical significance - z-test: Higher Applications of Maths
Excuse the emotional whiplash of going from heights of sportsmen to the biggest maritime disasters in history but a few questions on performing z-tests. Includes a dataset to draw figures from for the sportmen question.
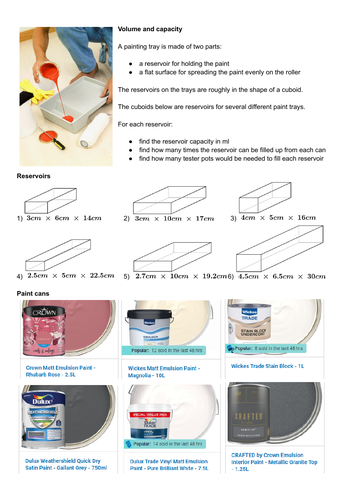
Volume and capacity painting tray task
A “how many Xs can you fill from Y” and volume of a cuboid task in the context filling painting trays from tins of paint. Aimed at a Scottish N4 Applications of Mathematics (Geometry unit) class .

Graphing continuous data (Spotify playlist data): Higher Applications of Maths
Pupils use histograms and boxplots to illustrate various continuous numerical variables in RStudio using a csv dataset.
Variables are values Spotify uses to categorise songs. Songs in the dataset and taken from a playlist.
A bit of fun included asking pupils to pick some songs that would suit the tastes of the person who created the playlist (me!). If you use this and pupils make suggestions let me know on Twitter at @bucksburnmaths.
To give pupils an idea of what tempo feels like I play them Juice by Lizzo which is 120 bpm. Also played them You Suffer by Napalm Death (1.3 seconds long) and Mogwai Fear Satan by Mogwai (16 minutes long) as a way of talking about outliers. Plus, any excuse to talk about the 1980s grindcore scene!

Pearson correlation coefficient tasks: Higher Applications of Maths
Two tasks:
One calculating the Pearson correlation coefficient by hand. A right pain in the backside and shows why we use computers to do such a thing (worth noting doing this by hand is something that could be assessed if doing Level 6 Numeracy).
One getting pupils used to coding the correlation coefficient using statistical software (using the attached csv dataset) and seeing what it means in terms of the regression line without context getting in the way.

Correlation and causation: Higher Applications of Maths
A task which involves generating scatterplots and correlation coefficients using nutritional information from a McDonalds menu.
Worksheet and csv dataset.
Points of interest:
Menu is from America leading to a discussion about how useful is it for use in UK
High number of breakfast items and low number of burgers doesn’t reflect common perception of McD’s menu
Sodium (ie salt) and calories have a strong correlation but this is a spurious relationship (salt has no calories) with portion size being a possible confounding variable

Statistical significance - t-test: Higher Applications of Maths
Worksheet and datasets for performing paired and independent t-tests on.
All bar one of the datasets are based on real life sources.

Scatterplots, correlation, interpretting parameters in bee colonies: Higher Applications
Question sheet and four datasets for use with appropriate statistical software.
Adapted from a Don Steward task about bee colonies.
Each question asks pupils to:
plot a scatterplot
calculate and interpret the correlation coefficient
find the equation of the regression line
interpret one or both of the equation parameters
make a prediction using the regression line

Pythagoas and Cuisenaire rods
A powerpoint to lead discussion introducing Pythagoras with Cuisenaire rods. A bit rough and ready / stream of consciousness in places but hopefully may be useful giving others some ideas / inspiration.
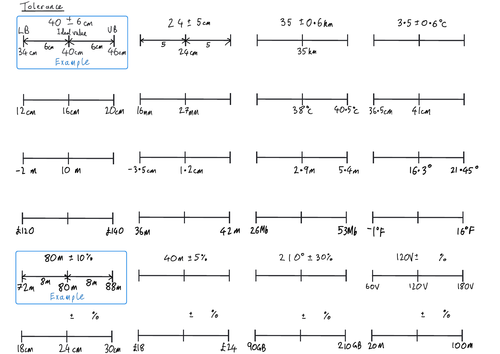
Tolerance: interpreting as a number line
Interpreting tolerance as a numberline and reversing the process (ie writing tolerance from upper and lower bounds)
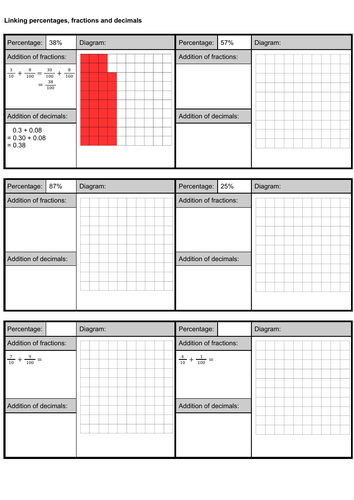
Fractions, decimals, percentages, diagrams
Trying to link fractions, decimals, percentages as well as making connections / laying foundations for ideas such as calculating percentages of amounts using blocks of 10% and 1%, division by 10 and 100, adding fractions, place value.
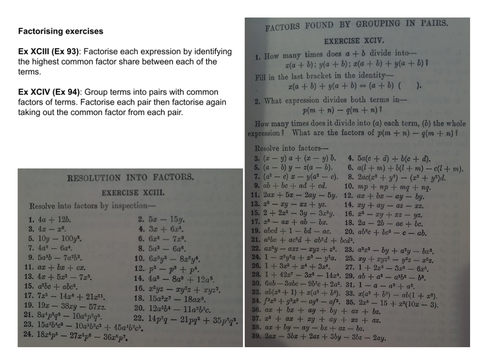
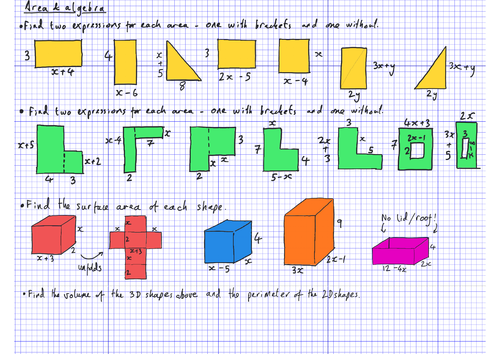
Area and algebra
Expanding a single bracket, linked to area of rectangles, compound shapes, and cuboid surface area.
A bit rough and ready being hand drawn on the ipad but some good questions in it nevertheless.
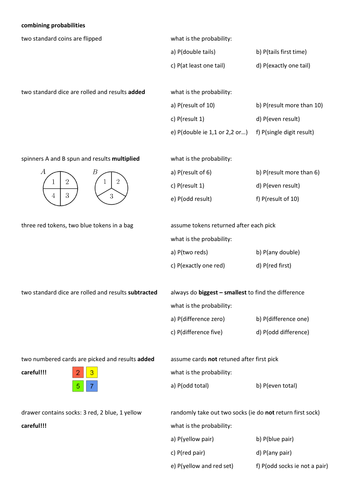
Probability - combining probabilities
A selection of problems look at combining probabilities by listing outcomes in a table or with tree diagrams. First questions are independent events, final two need more care (ie event 1 impacts event 2).
Editable word doc and pdf.
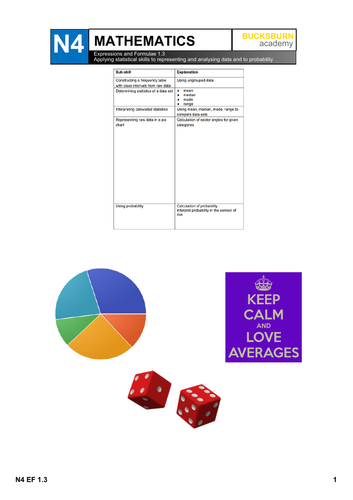
National 4 (N4) Mathematics: Expressions and Formulae 1.1, 1.2, 1.3 pupil notes
Smartboard files for use on an interactive whiteboard. PDF versions of the same file for printing as booklets and issuing to pupils. Notes contain examples for teachers to go over on the board and some tasks for pupils to do. Questions and examples have been sourced from various resources so make sure you’re not issuing the same task twice! At the end of these there are also revision questions and a checklist for pupils to “traffic light” their learning.
DISCLAIMER: There are most likely errors in here as I’m bad at proof reading my materials so read and check over before using!
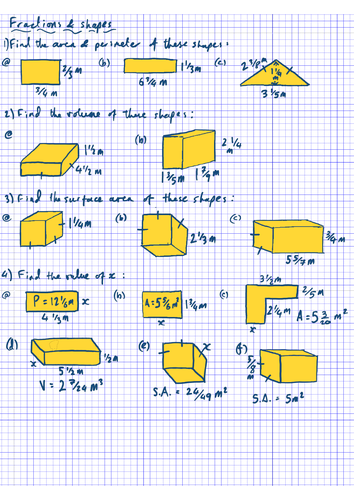
Mixed number and perimeter, area, and volume
Working with mixed number in the context if 2d and 3d shape. Some problems involve finding missing dimensions.
Hand drawn worksheet but some decent questions in it so who cares about looks?