

265Uploads
2111k+Views
2067k+Downloads
All resources
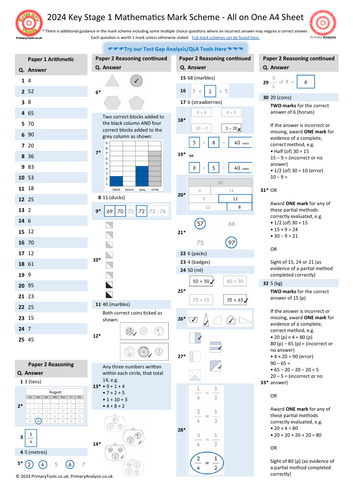
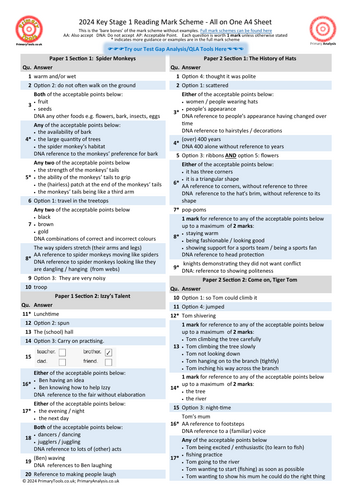
2024 KS1 SATs Mathematics Test Mark Scheme on a Page
2024 KS1 SATs Mathematics Test Mark Scheme on a Page

2024 Phonics Check Question Level Analysis
Summary of Features:
Pupil Summary shows total marks for each paper, number of questions unanswered, number of incorrect answers, total overall score (and percent), total score in each focus area. Option to adjust the colour thresholds to make it easier to spot patterns and gaps.
Pupil Reports show a summary of performance in each focus area for an individual pupil. Useful for feeding back to pupils, parents and informing intervention teachers.
Contextual Analysis (2019 versions onwards) shows a breakdown by key groups (gender, SEND status, disadvantaged, EAL) plus up to four custom groups. Compares school data (grades and scaled scores) to national data in a detailed but user-friendly report.
Cohort Summary shows an overview of the cohort against each focus area. This page gives a summary of attainment including number and percent meeting the expected standard.
Other Charts Charts which show performance for each question, organised by most correct to incorrect and by word type.
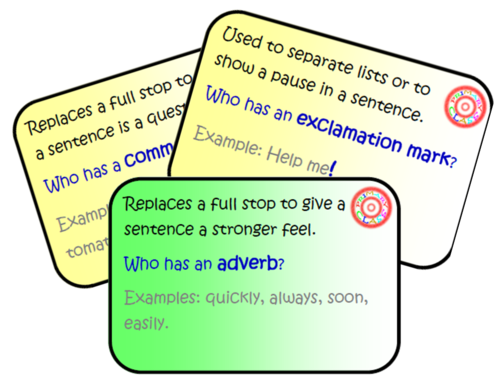
Punctuation 'Follow Me' Loop Card Game/Quiz
Colour coded for 3 levels of difficulty. Examples for each that can be used as ‘hints’.
Grammar and Punctuation version available here:
/teaching-resource/grammar-and-punctuation-follow-me-game-11187356
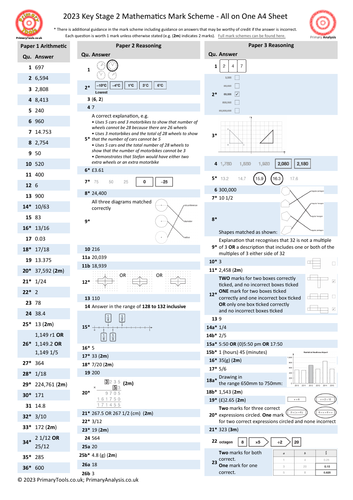
2023 KS2 SATs Mathematics Test Mark Scheme on a Page
2023 KS2 SATs Mathematics Test Mark Scheme on a Page
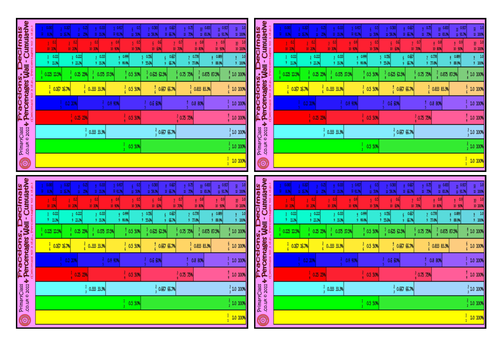
Fraction Decimal and Percentage Wall -Teaching Aid
A good teaching aid for Fractions, Decimals and Percentages. Different sizes (A5 and minis), colour or black & white, standard and cumulative versions , an only upload a portion here):
*Mega Fraction Decimal and Percentage Walls (A4)
*Fraction Decimal and Percentage Walls
*Fraction Walls
*Decimal Walls
*Percentage Walls

2024 KS2 SATs Mathematics Test and Question Level Analysis
2024 KS2 Mathematics Test and Question Level Analysis
Requires Excel with macros enabled.
Summary of Features
Questions Versus National compares the performance of your cohort against the performance of pupils nationally in each question. A powerful chart which instantly shows you which questions you are strong or weak on. As it uses national data, it considers the difficulty of each question, compares it the performance of your cohort and orders the results from strongest to weakest
Pupil Summary shows total marks for each paper, number of questions unanswered (possibly indicating need to increase pace), number of incorrect answers, total overall score (and percent), total score in each strand. Option to adjust the colour thresholds to make it easier to spot patterns and gaps. All Versions from 2016.
Pupil Reports show a summary of performance in each strand for an individual pupils. Useful for feeding back to pupils, parents and informing intervention teachers. All Versions from 2016.
Contextual Analysis shows a breakdown by key groups (gender, SEND status, disadvantaged, EAL) plus up to four custom groups. Compares school data (grades and scaled scores) to national data in a detailed but user-friendly report. All Versions from 2016.
Cohort Summary shows an overview of the cohort against each strand. This is also compared to national data where it is available. This page gives a summary of attainment including number and percent at expected and higher standard. All Versions from 2016.
Strand Summary shows a the weighting of each strand and the performance within it. For example, in a grammar test a cohort may perform poorly in identifying sentence types and equally poorly in identifying punctuation. However as there is more weighting given to punctuation, it would be advisable to focus on this area. All Versions from 2016.
Other Charts Charts which show performance for each question, organised by most correct to incorrect, by strand and also by year group question (for mathematics). The most powerful chart orders questions from most correct to incorrect enabling you to see precisely where there are strengths and weaknesses. All Versions from 2016.

2024 KS2 Reading Test and Question Level Analysis
Summary of Features:
Questions Versus National compares the performance of your cohort against the performance of pupils nationally in each question. A powerful chart which instantly shows you which questions you are strong or weak on. As it uses national data, it considers the difficulty of each question, compares it the performance of your cohort and orders the results from strongest to weakest.
Pupil Summary shows total marks for each paper, number of questions unanswered (possibly indicating need to increase pace), number of incorrect answers, total overall score (and percent), total score in each strand. Option to adjust the colour thresholds to make it easier to spot patterns and gaps. All Versions from 2016.
Pupil Reports show a summary of performance in each strand for an individual pupils. Useful for feeding back to pupils, parents and informing intervention teachers. All Versions from 2016.
Contextual Analysis shows a breakdown by key groups (gender, SEND status, disadvantaged, EAL) plus up to four custom groups. Compares school data (grades and scaled scores) to national data in a detailed but user-friendly report. All Versions from 2016.
Cohort Summary shows an overview of the cohort against each strand. This is also compared to national data where it is available. This page gives a summary of attainment including number and percent at expected and higher standard. All Versions from 2016.
Strand Summary shows a the weighting of each strand and the performance within it. For example, in a grammar test a cohort may perform poorly in identifying sentence types and equally poorly in identifying punctuation. However as there is more weighting given to punctuation, it would be advisable to focus on this area. All Versions from 2016.
Other Charts Charts which show performance for each question, organised by most correct to incorrect, by strand and also by year group question (for mathematics). The most powerful chart orders questions from most correct to incorrect enabling you to see precisely where there are strengths and weaknesses. All Versions from 2016.
Year 7+ KS3 Spelling Journal with lists & puzzles
Year 7+ (Age 11+) Based on KS3 Spelling Bank. Separated into 10 weeks, 10 words per week. Each week includes word list, practice space. wordsearch and anagrams. Notes and contents page also included. Printing as a booklet recommended to produce an A5 size book. Requires a pdf reader. If you have problems viewing the fonts, please contact me for an alternative version.