I create mathematics powerpoint and other resources for Key Stages 1, 2, 3 & 4, which are designed to clearly explain topics. These can be presented by the teacher, or accessed by individual students.
I can create bespoke resources.
Most KS2 and KS4 Maths Topics are in Bundles, as are the KS1 Powerpoint Mental Starters, or available separately If you'd like a bespoke bundle, please tell me the items you would like in it, and I will do this, at a discount of about 30% off total price.
A Powerpoint to explain how to calculate Best Value for Money. This powerpoint has 13 slides (Including one title and one end slide). Designed for KS4 / GCSE.
Two methods are examined.
Low Introductory Price for a Short Time Only,
A fantastic collection of 16 Powerpoint Presentations covering Number Topics for KS3.
There are over 800 slides altogether in the presentations (plus title and end slides for each one), with many examples to explain concepts clearly to pupils and students.
The presentations could be used by either a class teacher to explain the topics to a class or small group, but equally they could be used by individuals to see the methods for topics.
Topics covered are:
Addition: Integers and Decimals
BODMAS (Order of Operations)
Division: Integers and Decimals
Equality and Inequality Symbols
Factors, Multiples and Primes
Fractions
Multiplication: Integers and Decimals
Number Line and Types of Numbers
Percentages
Place Value
Powers and Roots
Putting Numbers in Order
Rounding Numbers
Standard Form
Subtraction: Integers and Decimals
Using Standard Units
A Powerpoint to explain Ratio and Proportion. This powerpoint has 33 slides (Plus one title and one end slide). Also there are three Ratio worksheets. Designed for KS2.
Topics covered in the powerpoint are:
Introducing Ratios
Simplifying Ratios
Solving Problems with Ratios
Introducing Proportion
Solving Problems with Proportions
Amended on 29 May 2020
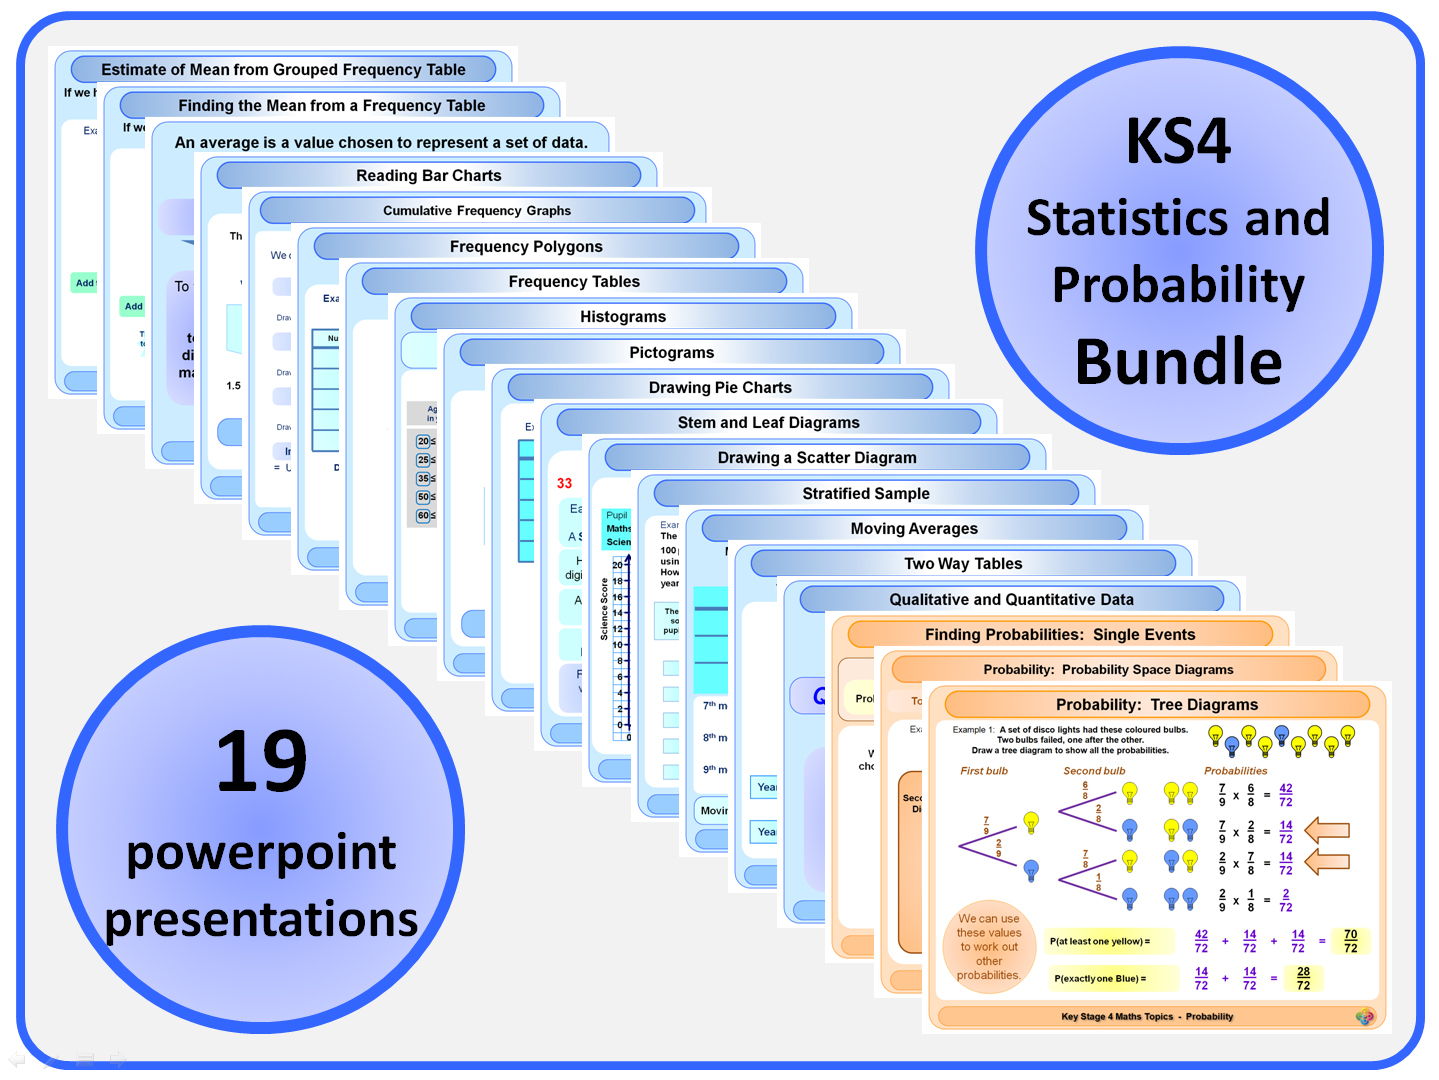
A short Powerpoint to explain Frequency Tables and Grouped Frequency Tables. This powerpoint has 6 slides, (Plus one title and one end slide), containing a total of 6 examples. The first two examples show frequency tables, and the other two show grouped frequency Tables. Designed for KS4 / GCSE.
Also included in a 2 sided A4 pdf worksheet “Frequency Tables and Grouped Frequency Tables”, containing 6 questions. Answers are also given.
UPDATED on 6 March 2020 (Examples in Powerpoint increased from 4 to 6)
This item offers better value for money when bought as part of the Statistics and Probability Bundle.
A Powerpoint to explain how to find Best Value for Money. This powerpoint has 8 slides (Plus one title and one end slide), so there are five examples in total. Designed for KS2.
Also included is a two sided A4 PDF worksheet, containing 12 questions. Full answers are also provided
Both the original powerpoint and the newly designed one are included
Graphical Solutions of Simultaneous Equations KS3
PLEASE NOTE: Added on 9 Feb 2021.
Introductory Price for a couple of weeks of £2.00, then this resource will increase to £2.50.
This individual powerpoint presentation is from the KS3 Maths Topics Series.
It contains 17 slides (Plus a title and end slide), so there are lots of examples. This is an ideal resource which you will enjoy using to explain Graphical Solutions of Simultaneous Equations to your classes for years to come.
The powerpoint explains:
Linear Simultaneous Equations
Solving Linear Simultaneous Equations Graphically (10 Examples)
Simultaneous Equations with a Linear and a Quadratic Equation (5 Examples)
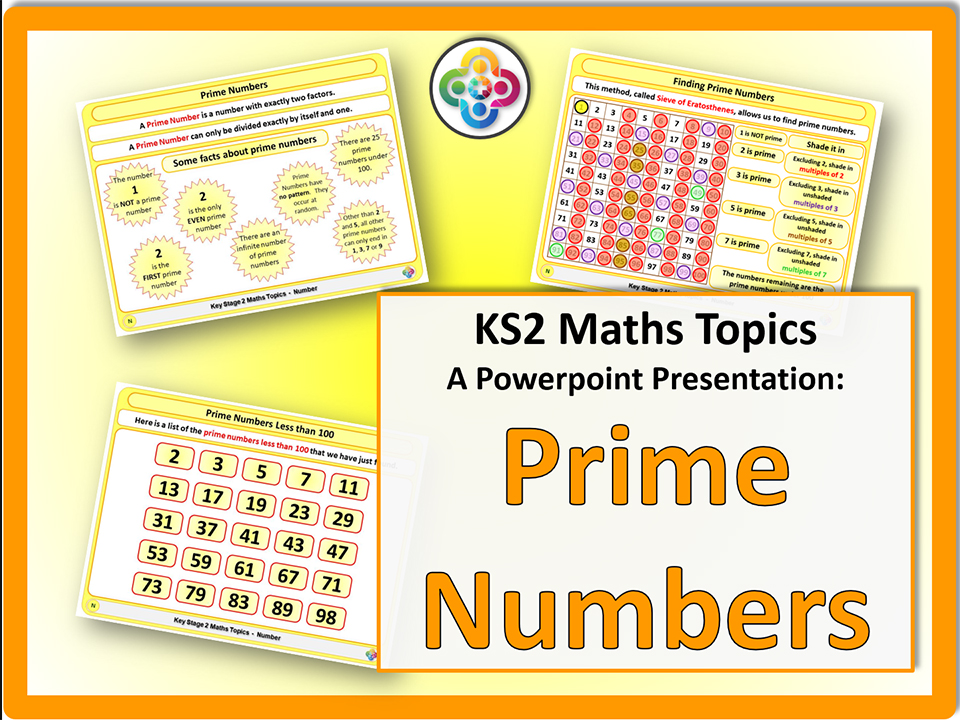
A Powerpoint to explain Prime Numbers. This powerpoint has 3 slides (Plus one title and one end slide). Designed for KS2.
Also included is a single sided A4 pdf worksheet, “Finding Prime Numbers” which allows pupils to shade in a grid to find Primes under 100. Answers are also included.
A Powerpoint to explain how to find a Percentage of an Amount. This powerpoint has 14 slides (Including one title and one end slide). Designed for KS2.
This looks at:
Finding a Percentage of an Amount
Comparing Percentages of Amounts
A Powerpoint to explain Time. This powerpoint has 48 slides (Plus one title and one end slide). Designed for KS2.
Topics covered are:
Connection Between Times
Telling the Time
Finding the Gap Between Two Times
Revised on 11 Jun 2020
A Powerpoint to explain Tally Charts, together with four pdf worksheets.
This powerpoint has 7 slides (Plus one title and one end slide). Designed for KS2. There are three fully animated Tally charts, which shows the tally marks being added as the items appear (each item appears as the teacher clicks the powerpoint forward, and a bar chart follows each one.
PDF Worksheets (all of which have a version with the answers filled in) are:
A one-sided A4 worksheet so pupils can fill in their own tally charts as the animations appear on screen in the powerpoint, and draw the bar charts themselves.
A one sided A4 worksheet entitled “Monarchs of England and the UK: Tally Charts” where data relating to the length of reign of a number of monarchs is give to the nearest year, and this can be used to fill in the tally chart and draw a bar chart.
A one sided A4 worksheet entitled “Gases in the Air: Tally Chart and Bar Chart” . Here 40 people have given the name of one of the six gases in the air, and pupils make a tally chart of this data, and then draw a bar chart.
A one sided A4 worksheet entitled “Trees in a Wood: Tally Chart and Bar Chart” . Here 60 trees are given (6 different types), and pupils make a tally chart of this data, and then draw a bar chart.
I’ve also left the original powerpoint, which only has the tally charts.
Updated on 31st June 2018
A Powerpoint to explain Pie Charts. The new powerpoint has 15 slides (Including one title and one end slide). Designed for KS2.
This covers:
Introducing Pie Charts
Values from Pie Charts
Drawing Pie Charts
The original powerpoint is also included.
A Powerpoint to explain Simple Interest. This powerpoint has 12 slides (Including one title and one end slide). There are a total of 10 examples, all similar to the one depicted. Designed for KS4 / GCSE.
10 Fantastic Powerpoint Mental Starters to promote Cross Curricular Numeracy. This set looks at Numeracy in PE. Each of the 10 powerpoints has 20 questions, with the answer following each question, so these can be used not only as starter activities, but at any point in the lesson.
They could be used in a mathematics lesson to develop numeracy skills using topics in PE as a backdrop, or alternatively in a PE theory lesson so focus on the numerical elements of some PE topics.
The 10 powerpoints are:
2012 Olympic Medal Bar Chart
This looks at a “triple bar chart” showing the number of gold, silver and bronze medals won by 6 countries in the 2012 Olympic games. There are 20 questions related to this bar chart.
Average Speed
This uses given distances and times for races to calculate the average speed, in metres per second.
Body Mass Index
This gives the BMI formula and students are required, with the aid of a calculator, to calculate BMI values from given data, and determine which weight category this relates to.
Cardiac Output
With the aid of a calculator, students are asked to find the missing values in the Cardiac Output equation given.
Heart Rate Graphs
20 questions for students to answer using the heart rate against time graphs given.
Marathon Fractions and Percentages
From the figures for each marathon race, students are asked to give the fractions and percentages asked in the questions.
Snooker Angles
The animated path of a ball on a snooker table is shown, and students are then asked to calculate angles in straight lines from the given angles.
Sports Equipment Purchases
In each question, a different sports item, together with the cost per item is given, and students are asked to calculate the total cost for purchasing the given number of items.
Sports Pictograms
10 questions each for two different pictograms are given - 20 questions in total.
Swimming Data
A table of swimming data is given, and questions are asked using the data in this table.
Standard Form for KS3 Maths
This individual powerpoint presentation is from the KS3 Maths Topics Series.
It has been totally revised on 25 Sept 2020.
It contains 57 slides (Plus a title and end slide), so there are lots of examples. This is an ideal resource which you will enjoy using to explain Standard Form to your classes for years to come.
There are also an additional 40 slides containing examples using an additional method (which some students may find easier to use).
The powerpoint explains:
Standard Form
Writing Large Numbers in Standard Form
Writing Small Numbers in Standard Form
Converting a Standard Form Number to ‘Ordinary’ Form
Comparing the Size of Standard Form Numbers
Alternative Methods:
Writing Large Numbers in Standard Form
Writing Small Numbers in Standard Form
Number Line & Types of Numbers for KS3
This individual powerpoint presentation is from the KS3 Maths Topics Series.
It contains 27 slides (Plus a title and end slide), so there are lots of examples. This is an ideal resource which you will enjoy using to explain numbers on a number line to your classes for years to come.
The powerpoint explains:
Number Line
Positioning Numbers on a Number Line
Greater Than and Less Than Symbols
Types of Numbers: Natural, Integers, Rational, Real
A Powerpoint to explain Solving Simultaneous Equations Graphically. This powerpoint has 11 slides (Including one title and one end slide). Designed for KS4 / GCSE.
A Powerpoint to explain Area of quadrilaterals. This powerpoint has 10 slides (Including one title and one end slide). Designed for KS4 / GCSE.
Topics included:
Area of a Rectangle
Area of a Parallelogram
Area of a Trapezium
Area of a Kite
A Powerpoint to explain how to read a train timetable. This powerpoint has 22 slides (Plus one title and one end slide). Three different timetables are used in the examples. Designed for KS2.
Also included is an A4 worksheet with 12 questions plus answers.
I’ve also added the new powerpoint using different title slides and slightly modified layout.