Welcome to my shop. My aim is to provide high quality teaching, learning and assessment resources. In the case of GCSE and A Level resources I am adding examination questions to my resources as more become available. Please come in and browse. Feel free to contact me about any of the resources that you buy or if you are looking for something in particular.
Welcome to my shop. My aim is to provide high quality teaching, learning and assessment resources. In the case of GCSE and A Level resources I am adding examination questions to my resources as more become available. Please come in and browse. Feel free to contact me about any of the resources that you buy or if you are looking for something in particular.
This lesson is designed to get students to consider the advantages and disadvantages of re-urbanisation, using the Stratford Olympic Park as an example. To start the pupils are given a definition of re-urbanisation. Next, there are a series of photos and videos to develop the students sense of place and understanding of how the park has changed the area. After that the students are given 9 facts about the advantages of re-urbanisation and are asked to classify them as social, economic or environmental (answers included). They then use a diamond 9 to organise them from most important to least important. They then repeat this task for the disadvantages of re-urbanisation. The lesson ends with a quiz which requires the students to classify the facts into either advantages or disadvantages. All resources and answers are included in the PowerPoint.
The lesson is an opportunity for students to work in small groups to write persuasive speeches and give presentations. The lesson starts by students working in pairs to recall key terminology. Next students are given maps of the UK and the world showing gains and losses from global warming (taken from Wider World). They have to highlight these images picking out the 3 most important gains and losses on each image. Next the class is split into groups with a specific remit e.g. UK gains from global warming. They are given a persuasive writing fame and asked to write a speech convincing the class of their viewpoint. The most able students in the class should be given the ‘losses vs gains’ speech as this is the most challenging. Prior to the speeches go through the dos and don’ts to help improve the quality of the speeches. Finally finish with an opinion line, selecting a few students to justify their opinions.
This contains resources to help students to prepare for statistical questions in their examinations. There are information/revision sheets for each type of statistical test (Mann Whitney, T test, Chi squared and Spearman’s Rank). These include a definition, worked example and significance analysis. In addition there are formulas for mean, mode, median, range, upper quartile, lower quartile and interquartile range.There is also a worked example for upper quartile and standard deviation. Next, there is a card sort with definitions and examples. After that there are a number of opportunities to calculate upper quartile, lower quartile, inter quartile range, mean, mode, median and standard deviation, with answer slides included. At the end of the PowerPoint are the Student resources.
This resource includes a wide of data collection sheets which could be used with KS3 to A Level including beach profile, cost of coastal defences, evaluation of the effectiveness of defences, field sketching, groyne height measurements, wave information. They can easily be adapted to any location you are studying and incorporated into your own fieldwork booklet.
This is a debate / decision making exercise and should take place over a three of lessons, two to plan and one to undertake the debate. Firstly, there are two video clips about the oil industry in Prudhoe Bay, Alaska in order to develop the students sense of place. Next, based on a geofile (website for access supplied) students should evaluate the advantages and disadvantages of oil and gas production and consumption in Prudhoe Bay. After that students are split into 4 groups. Each group is given a character card with details about their viewpoint and a writing frame. Using the writing frame and geofile students should develop a speech about their views on oil and gas production and exploration in Prudhoe Bay. This will take 2 lessons.
In the third lesson the groups should give their presentations. whilst speaking sheets are provided to take notes on the viewpoints of others and writing down questions to ask them. After every speech undertake a discussion activity based on what has been said. Then debate the two key questions once everyone has spoken. Next the students will be asked to suggest compromises and work towards and agreement, before final voting. At the end pupils will be asked to complete and opinion line task for both the questions and to feedback the reasons for their opinions. To increase student engagement each student is assigned two other students to observe using the engagement tally chart, they should record the student’s engagement at 3 points in the lesson. At the end of the lesson the students can give feedback to the students that they have observed. There are also ask and answer stickers for the studnets to stick on themseves. they can take these off once the have asked/answered a question.
I have added an essay question at the end of the powerpoint which could be planned in the lesson and completed for homework. There are planning sheets and fact sheets to help the students to produce high quality essays. All resources are included at the end of the PowerPoint.
This booklet includes a wide range of fieldwork based on the Cumbrian coast, that can be adapted for use in any area. Fieldwork techniques include; beach profiles, groyne heights, field sketching, wave counts and defence analysis.
In this lesson students will learn how to measure straight line distance and actual distance.
Firstly, the students will learn how to measure straight line distance using the map skills booklet and the Cambridge maps (I have enclosed a copy but you will need to enlarge them so 2cm =1km).
Next, there is a video and an explanation of how to measure straight line distances, accompanied by a series of Cambridge map questions.
After that there are two more scale questions, also included in the map skills booklet.
Answers to all activities are included in the PowerPoint.
This lesson contains a worked example followed by a series of exercises where the students can practice and apply their knowledge. Included within the PowerPoint are worksheets for the students to fill in and a full set of answers, including worked calculations. I designed these to be used either as homework tasks or as an introductory lesson / skill practice lesson. They are also designed to encourage the students to memorise the formulae as these will not be included in the exam papers even at GCSE level.
This bundle contains two lessons including resources for the students to develop their statistical skills. The skills included are mean, mode, median, interquartile range and dispersion diagrams. There are worksheets for the students to use as well as answers with calculations. Perfect for skills practice in the lead up to the examinations or for the initial teaching of these skills.
In the lesson Students will recap 4 figure grid references before being introduced to giving and reading 6 figure grid references. There are map quizzes (with answers) based on Lyme Regis (Miss Reynolds’ crazy day) and Cambridge maps .
There are a number of other maps skills quizzes and answers included in this PowerPoint which will allow you to fill two or more lessons these include:
Santa’s day out - River Wye Maps
Map skills quiz - Nant Francon & Wastwater / West Cumbria Maps
Map skills revision Avery Hill maps
All tasks are included in the map skills booklet and all maps are included but will need enlarging so 2cm = 1km.
The lesson incorporates a range of activities. To start there is a short video clip from the day after the earthquake. Next are slides including maps and plate margin diagrams which can be explained to pupils prior to them completing a gap fill exercise, which explains how the earthquake occurred. After that are a selection of photos of the damage, which can be used for Q and A with the pupils, including a 2 minute video clip of people being rescued from the rubble. I have then included a link to the BBC panorama programme which includes information about the earthquake and explanation of why so many people died. A note taking sheet is included. Next is a fact classification activity, with information about both Syria and Turkey. Finally there is a homework task. All resources are included at the end of the lesson.
This lesson starts by giving the students to take lecture notes on El Niño and La Niña. Next they are introduced to the normal weather conditions in the Pacific before being given diagrams of the normal conditions and El Niño so they can spot the difference. Students are then introduced tot he characteristics of El Niño. After that they are introduced to the characteristics of La Niña. In order to develop their understanding the students are then required to produced their own annotated diagrams of El Niño and La Niña on a base map they are given. To further secure their understanding they undertake a discussion activity in pairs. To test their understanding students complete a summary table (answers provided). Next there is an examination questions for students to test their understanding (answer provided). Finally there is a whiteboard quiz. All resources are included at the end of the PowerPoint.
This lesson contains a worked example followed by a series of exercises where the students can practice and apply their knowledge. Included within the PowerPoint are worksheets for the students to fill in and a full set of answers, including worked calculations. I have also included two questions featuring dispersion diagrams to calculate interquartile range. I designed these to be used either as homework tasks or as an introductory lesson / skill practice lesson. They are also designed to encourage the students to memorise the formulae as these will not be included in the exam papers even at GCSE level.
Firstly students are introduced to shifting cultivation, as a sustainable way for tribes to live in the rainforest. Students are then asked to use the information provided to undertake comprehension activities on 3 schemes; reforestation, conservation and improvements in agriculture in the Amazon. there is also a youtube video link to accompany the conservation scheme. Students are provided with note taking sheets and should ensure their notes focus on the impacts of the 3 schemes on the carbon and water cycles. To finish students evaluate the 3 schemes before reaching a conclusion as to which is the most effective. This is part of a series of lessons and is available as a bundle.
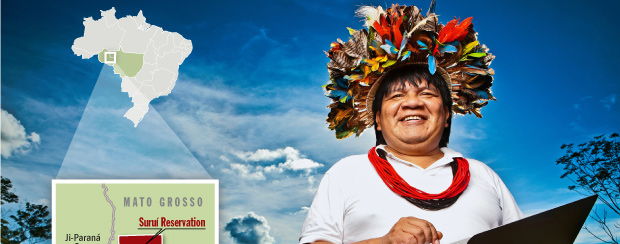
This lesson is part of a series of lessons about the rainforest ecosystem and is available as part of a bundle. This lesson starts by recalling some of the threats to the rainforest. It then introduces the idea of shifting cultivation and how it is sustainable. Next there are a series of photos of reasons for deforestation e.g. logging, mining, ranching, faming. Students are asked to consider why this is not sustainable and why it would be difficult to regrow the forest. They are then introduced to 4 schemes designed to manage the rainforest the Surui-Google partnership, REDD+, Ecotourism and sustainable agroforestry. In a group of four the students are given the information about one of the projects to simplify the project into a mind map. The groups can then give a speech presenting their findings to each other. Next they are asked to complete gap fill paragraphs explaining each project. Finally, students should work as a group to consider the relative strengths and weaknesses of the projects and evaluate which is most successful. All resources are included at the end of the PowerPoint.
This lesson starts by students interpreting temperature graphs of the quaternary showing different time scales. Next the students create a timeline from 14,000BP to the present day. They label the different climatic periods during this time and ad photos showing the different climatic features. Finally they annotate important characteristics for different climates, using a table of information to help them to do this. An answer sheet is included. To finish there is a quiz to test their knowledge of the changes. All resources are included at the end of the PowerPoint.
In this lesson students will learn about the causes of the enhance greenhouse effect. Students start the lesson with a gap fill activity explaining the greenhouse effect. Next they are introduced to the composition of the atmosphere and which gases are greenhouse gases before defining the enhanced greenhouse effect. Then the students will complete flow charts about how methane and carbon dioxide is produced, these will be enhanced by selecting factual information from a sheet to apply to the flow charts. After that students will practice their graphical skills deciding whether a data set is discrete or continuous and selecting a graph to draw, before plotting a pie chart accurately using a protractor. Finally, there is a multiple choice examination question to finish the lesson. All resources are provided at the end of the PowerPoint.
This booklet contains 7 varied homework activities to complement a scheme of work related to tectonics. The aims and instructions of each tasks are clearly laid out at the start of the task. At the end there is space for assessment and WWW and EBI comments.
Included are a range of urban fieldwork data collection sheets that can easily be used in any urban environment. They include index of decay, housing density, housing age, counter-urbanisation.
In this lesson pupils will learn about the geology of the river Eden, Cumbria. The lesson incorporates maps, photos and diagrams to help the pupils to develop their understanding. They record their information on a work sheet about the river landscape. They are the required to use their notes on river management (human activity) and river landforms to complete the rest of the river landscapes work sheet. There are a range of examination questions based on the sample assessment materials to show the pupils how they could be asked about the landscape. There is also a mark scheme and a quiz with answers.