All my resources have been created to use with classes I teach. Often I've created resources because, for a particular topic, I haven't been happy with the number/standard of the examples in a textbook. Sometimes I've created worksheets for certain topics (e.g. graph transformations) because I feel my classes will make greater progress on a printed worksheet than trying to work from a textbook. I always aim to produce high-quality resources that improve the students' learning and understanding.
All my resources have been created to use with classes I teach. Often I've created resources because, for a particular topic, I haven't been happy with the number/standard of the examples in a textbook. Sometimes I've created worksheets for certain topics (e.g. graph transformations) because I feel my classes will make greater progress on a printed worksheet than trying to work from a textbook. I always aim to produce high-quality resources that improve the students' learning and understanding.
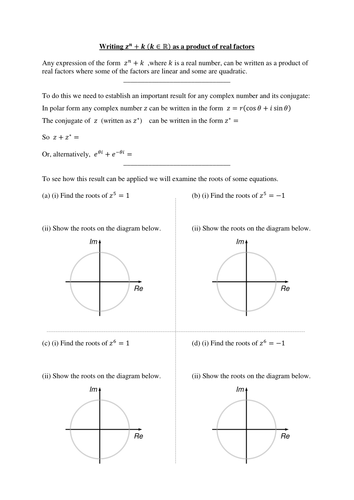
The first resource guides your class through the process of using the real and complex roots of z^n+k=0 to write down its real factors.
The introduction includes the important result about the sum of conjugates and then uses equations of the form z^n=1 or z^n=-1 to establish that there is always an even number of complex roots, which can be put into conjugate pairs. It is then shown how each conjugate pair of roots produces a real quadratic factor, while each real root produces a real linear factor.
To practise all this there is an exercise with 7 questions for students to complete. Solutions to all the examples and the exercise are included.
The second resource contains an exercise with further examination-style questions on this topic. This could be used as additional practice in class or as a homework/test. Answers are provided.
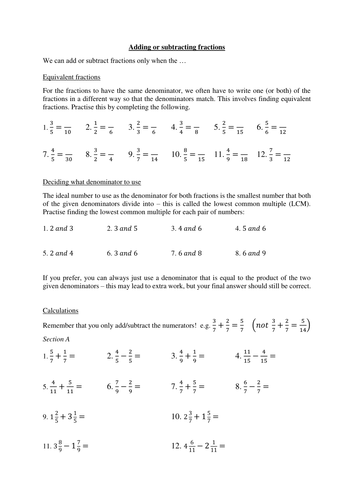
These are two 2-sided worksheets that cover all calculations with fractions.
The adding/subtracting worksheet goes step-by-step through the process of making the denominators equal prior to the calculation. The first exercise (12 questions) involves adding/subtracting fractions and mixed numbers where the denominators match, the second exercise (34 questions) involves adding/subtracting fractions and mixed numbers where the denominators do not match.
The multiplying/dividing worksheet begins with a reminder of the method, together with a few examples to work through as a group. There are then two exercises, each with 20 questions, first to practise multiplying and then to practise dividing fractions and mixed numbers.
Fully worked solutions to all questions are provided.
These 3 resources cover the following types of percentage question:
1. Writing one quantity as a % of another
2. Finding a % of a quantity
3. Increase/decrease by a %
4. Finding the % change
Each resource is split into a non-calculator section and a calculator section. Each section has an introduction where the method(s) is/are explained with some examples to illustrate, followed by an exercise for students to complete.
In total there are over 150 questions for students to work through - all solutions are provided.
The first resource introduces the technique for writing a complex number z=a+bi in (trigonometric) polar form, r(cos (theta)+ i sin(theta)), there are few examples of converting from one form into the other (to do as a class), and then an exercise of 30 questions for students to do. The next section introduces the exponential polar form re^(i theta), a few examples of converting from one form into the other (to do as a class), and then an exercise of questions for students to do. The exercise includes questions that get students to consider what z* and -z look like in both polar forms, as well as investigating multiplying and dividing complex numbers in polar form. Answers to the exercises are included.
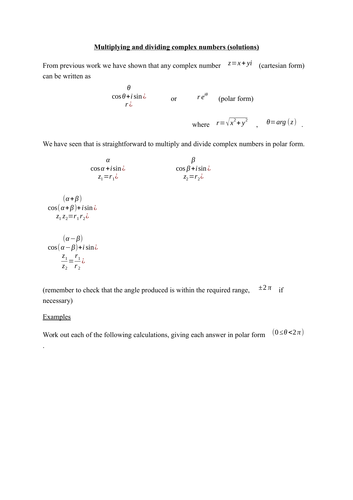
The second resource begins with a reminder of how to multiply/divide complex numbers in polar form, followed by an exercise of questions to practise. The remaining 3 pages cover the geometrical effect of multiplying, with several examples for students to learn from. Fully worked solutions are included.
The final resource focuses on examination-style questions that consider the geometric effect of multiplying by a complex number in polar form. Fully worked solutions are included.
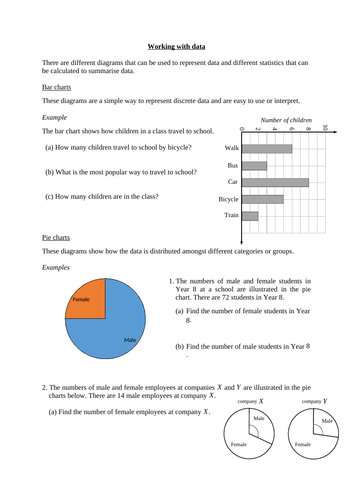
This 26-page resource covers all the required knowledge for diagrams and calculations to summarise or represent data in the new A level. In every section it contains examples to work through with your class followed by an exercise of questions for students to attempt themselves (answers included).
The sections are:
1. Bar charts and pie charts - revision of interpreting these simple diagrams
2. Averages of a list of data
3. Range and interquartile range of a list of data
4. Histograms - drawing them, interpreting them and using them for probability
5. Cumulative frequency - using the diagram to find median, IQR, percentiles etc
6. Box-and-whisker plots - interpretation and use to compare 2 sets of data
7. Standard deviation - calculation from a list of data or summary statistics
8. Frequency tables - finding averages/measures of spread from (grouped) frequency tables
9. Scatter diagrams and correlation - interpretation of diagram, PMCC, use of line of best fit
10. Outliers - investigating presence of outliers in a list/table of data or a diagram
Also provided is an 8-page resource which contains lots of practice of problems that involve finding the variance or standard deviation of different sets of data (answers are included).
This projectable and printable resource will save you having to draw any tables/diagrams when teaching the topic and will make things easier for your students as they can just work directly on the provided tables and axes, as well as drawing on the provided diagrams to help interpret them.
Also included is a homework/test that covers the whole topic - fully worked solutions are provided.
Here is an example of one of my A level resources that is freely available:
/teaching-resource/differentiation-and-integration-with-exponential-and-trigonometric-functions-new-a-level-11981186
I'm teaching 3 different year 12 classes this year so I created 3 slightly different tests for the work I've covered with each. The first test focuses on quadratics (1 question on disproof by counterexample), the second and third both focus on quadratics and using graphs (also with 1 question on disproof by counterexample). All tests come with fully-worked solutions and they can be amended to your requirements.
This 29-page resource covers all the required knowledge for probability in the AS part of the new A level. In every section it contains examples to work through with your class followed by an exercise of questions for students to attempt themselves (answers included).
The sections are:
1. Sample space diagrams
2. Two-way tables
3. Tree diagrams
4. Venn diagrams and set notation
5. Independent, mutually exclusive and complementary events
6. Probability distributions
7. Arranging items (preliminary work for Binomial distribution)
8. Binomial distribution
This projectable and printable resource will save you having to draw any tables/diagrams when teaching the topic and will make things easier for your students as they can just work directly on the provided tables and diagrams.
Also included is a worksheet designed to specifically practise writing cumulative probability calculations in the required form for using a calculator.
The 2 page assessment covers all aspects of the topic and fully worked solutions are provided.
Lastly, I have included a spreadsheet that calculates and illustrates probabilities for any Binomial distribution with n up to 100. You may find this resource useful to show the shape of the distribution and, in later work, how the distribution approximates a Normal distribution in certain conditions.
Here is an example of one of my A level resources that is freely available:
/teaching-resource/differentiation-and-integration-with-exponential-and-trigonometric-functions-new-a-level-11981186
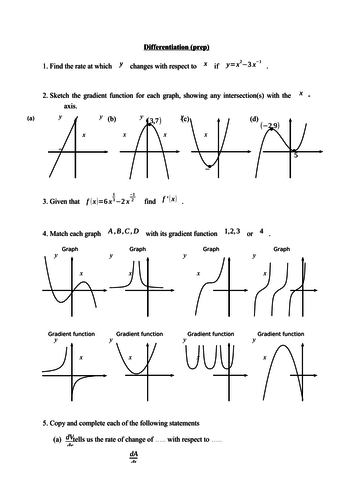
This 21-page resource introduces the method of differentiation as required for the new A level. In every section it contains examples to work through with your class followed by an exercise of questions for students to attempt themselves (answers included).
The sections are:
1. Gradient function - sketching the graph of the derivative of a function
2. Estimating the gradient of a curve at a point, leading to differentiation from first principles
3. Differentiation of ax^n
4. Simplifying functions into the required form before differentiating
5. Using and interpreting derivatives
6. Increasing and decreasing functions
7. Second derivatives
This projectable and printable resource will save you having to write out any notes/examples or draw any graphs when teaching the topic, and will make things easier for your students as they can just work directly on the given axes and spaces provided for solutions.
Also included is a 2-page assessment that can be used as a homework or test. Fully worked solutions to this assessment are provided.
Here is an example of one of my A level resources that is freely available:
/teaching-resource/differentiation-and-integration-with-exponential-and-trigonometric-functions-new-a-level-11981186
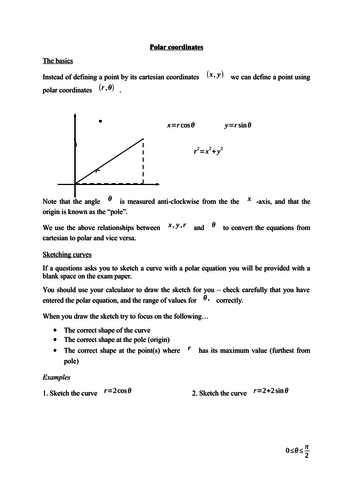
This resource can be used to teach your students all the required knowledge for the topic of polar coordinates (FP2) and contains examples to work through with your students. As the resource can be projected/printed it saves you time and allows your class to focus on understanding the techniques and attempting questions.
The resource is split into six sections:
1. Defining points in polar coordinates and sketching curves
2. Tangents at the pole
3. Lines of symmetry
4. Maximum value of r
5. Converting between cartesian and polar form
6. Finding areas
Note that this resource does not contain the answers to the examples - sorry! If I get time I will add them, or if you download and use this resource and send me your solutions I will add them in, crediting you of course.
This assessment has a non-calculator section and a calculator section.
it covers the following skills:
1. Writing one quantity as a fraction/percentage of another
2. Converting mixed numbers and improper fractions
3. All four calculations with fractions
4. Finding a fraction/percentage of a quantity
5. Percentage increase/decrease
6. Finding the percentage change
Fully worked solutions are included.
This worksheet gives your students practice of converting the vector equation of a line into the cartesian equation, and vice versa (there are 10 of each).
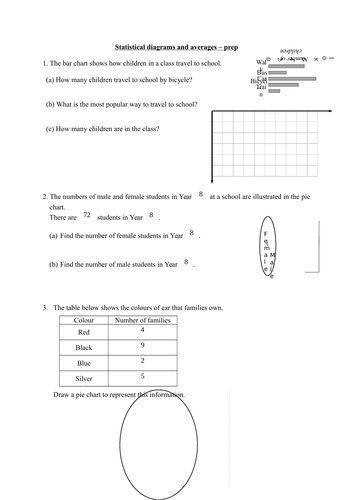
I used this resource as a homework with my Year 10 group after finishing work on statistical diagrams and the calculation of averages and the range.
It has at least one question on each of the following:
1. Bar charts
2. Pie charts
3. Mode, median, mean and range from a list of data
4. Finding the missing value in a set of data given the mode/median/mean.
5. Finding the new mean after a data point is added/removed.
6. Finding averages from a frequency table and a grouped frequency table.
Fully-worked solutions are provided.
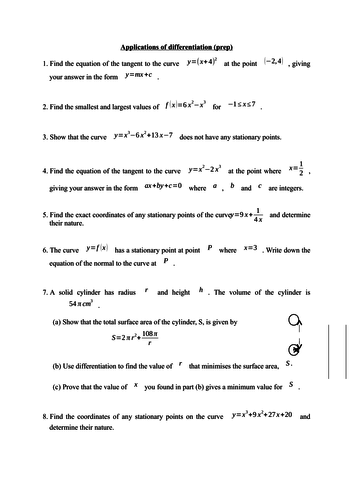
This 18-page resource covers all the uses/applications of differentiation as required for the new A level. In every section it contains examples to work through with your class followed by an exercise of questions for students to attempt themselves (answers included).
The sections are:
1. Tangents and normals - finding the equations of tangents/normals to curves
2. Stationary points - finding them and determining their nature using first or second derivative
3. Smallest and largest values of a function - finding min&max value of f(x) in a set of values for x
4. Practical problems - using differentiation to find optimal solution to a problem in context
This projectable and printable resource will save you having to write out or create any notes/examples when teaching this topic. It also increases how much you can get through in lessons as students don’t have to copy notes/questions and can work directly onto spaces provided for solutions. You could also email/print some or all of this for students who have missed lessons or need additional notes/practice/revision.
Also included is a 2-page assessment that can be used as a homework or test. Fully worked solutions to this assessment are provided.
Here is an example of one of my A level resources that is freely available:
/teaching-resource/differentiation-and-integration-with-exponential-and-trigonometric-functions-new-a-level-11981186
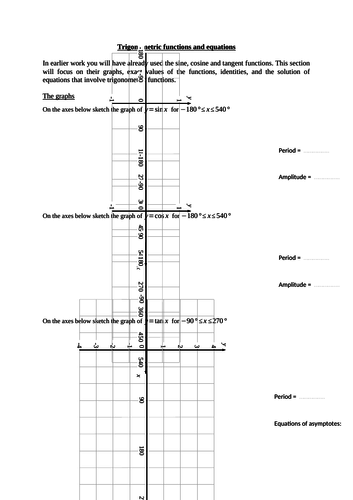
These 2 resources cover all the required knowledge and techniques for trigonometry, as required for the AS part of the new A level. In every section it contains notes, explanations and examples to work through with your class followed by an exercise of questions for students to attempt themselves (answers included).
The first resource is a 27-page booklet which covers the following:
1.The graphs of trigonometric functions, their period and amplitude/asymptotes
2.Exact values of trigonometric functions
3.Trigonometric identities
4.Finding the value of other trigonometric functions given, for example, sin x = 0.5 where x is obtuse
5.Solving trigonometric equations (3 different exercises on this, with increasing difficulty)
The second resource is a 13-question assessment that can be used as a homework or test. Fully worked solutions to this assessment are provided.
The third resource is a 15-page booklet which covers the following:
1.Using the sine rule to find angles/sides in a triangle
2.Ambiguous case of the sine rule
3.Using the cosine rule to find angles/sides in a triangle
4.Area of triangle = 0.5ab sin C - using this, together with the other rules, to determine the area of a triangle
This projectable and printable resource will save you having to create or write out any notes/examples when teaching the topic, and will make things easier for your students as they can just work directly on the given spaces provided for solutions. Answers to all exercises are included.
Here is an example of one of my A level resources that is freely available:
/teaching-resource/differentiation-and-integration-with-exponential-and-trigonometric-functions-new-a-level-11981186
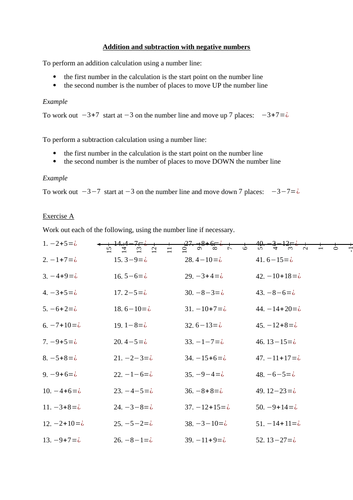
My year 7 class struggled to learn the rules for doing calculations that involved negative numbers so I created these resources to try to help them understand the rules and to give them lots of practice.
The first resource focuses on addition and subtraction, with explanations of how the calculations can be understood with reference to a number line, and then exercises with lots of practice (over 150 questions).
The second resource focuses on multiplication and division, with a page dedicated to them just practising determining whether the answer of a calculation should be positive or negative, and then an exercise with lots of practice calculations (over 80 questions).
The third resource contains mixed questions with all 4 operations (over 60 questions).
Answers to all the questions are included.
The final resource is a spreadsheet where pupils can practise calculations and get instant feedback on their accuracy. Note that the spreadsheet contains macros so when opening the file users may need to click on “Enable editing” or “Enable macros” for it to function correctly.
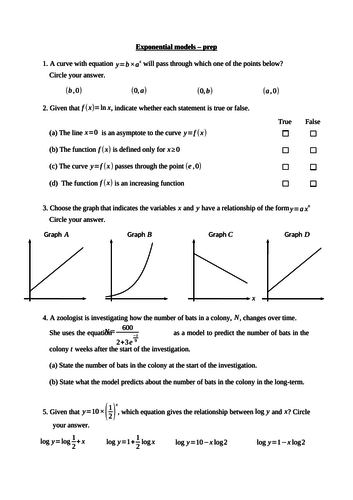
This assessment covers all aspects of the exponential models topics for all examination boards.
It contains 20 questions, ranging from simple multiple-choice questions that would be worth 1 mark, to demanding multi-stage problems typical of specimen examination questions.
An answer sheet is provided for students to work on (with axes provided for questions that require graph work).
Fully-worked solutions are included.
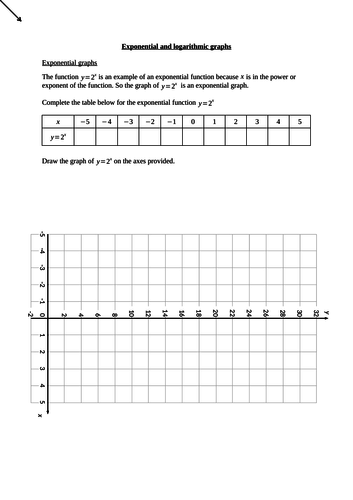
This resource is designed to introduce the key properties of exponential and logarithmic graphs that students need to understand for the topic of exponential models. Explaining the key properties of exponential graphs to students who haven’t learned chain rule is tricky so this printable/projectable resource may be a good way to help improve your students’ understanding and save you time as it has examples and exercises already prepared.
It begins with learning the shape of exponential graphs by plotting points, drawing the curves and then summarising the properties of each graph (first y=a^x and then y=a x b^x). There is then a short exercise (23 questions) where they practice sketching exponential graphs and determining the equation of a given graph.
The next section involves sketching the gradient function for different types of graph (linear, quadratic, cubic and reciprocal) and this work leads towards the idea that the gradient function of an exponential graph is itself exponential.
To build on this the students are then given the result for the gradient of y=a^x. The exercise that follows allows them to establish by themselves that for dy/dx=y we require that a = e.
Students can then prove (without use of chain rule) that the gradient of y=e^(kx) is y=ke^(kx), a key property of exponential models. There are then some examples and an exercise for students to practise using this result.
The final section gets students to plot the graph of y=ln(x) and summarise its properties. Some examples and an exercise of questions connected the graph of y=ln(x) then follow.
Answers to all the exercises are included.
Here is an example of one of my A level resources that is freely available:
/teaching-resource/differentiation-and-integration-with-exponential-and-trigonometric-functions-new-a-level-11981186
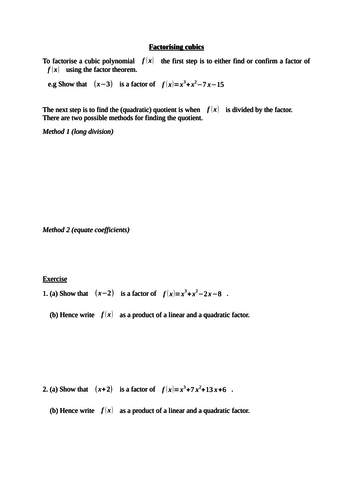
These resources will give your class plenty of practice of using the factor theorem and the common questions that follow finding a factor of a cubic polynomial.
The first resource focuses on showing that (ax+b) is a factor of f(x) and then using it to write f(x) as a product of a linear and quadratic factor. There is an example to work through as a group and then an exercise with 14 questions - answers are provided.
The second resource has 2 sections. The first section focuses on factorising cubics fully, either as a product of a linear and quadratic factor, or as a product of 3 linear factors. The second section focuses on solving f(x)=0 and, in later questions, relates the solutions to the graph of f(x). In total there are 26 questions - answers are provided.
This 2-page resource is a great way to assess your students after teaching them combined graph transformations and the modulus function for the new A level specification.
The resource is designed for students to write on the sheet in the spaces or on the axes provided for questions that require sketches.
Fully worked solutions are included.
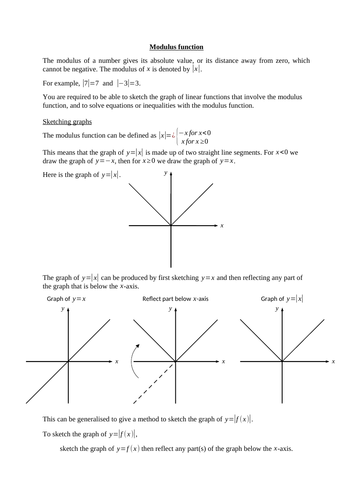
This resource is a great way to cover this whole topic using prepared notes and examples to explain it to your students. Projecting the notes/examples will save you a lot of work on the board and your students will save time by working on the provided spaces and axes when doing sketches. You could also email/print some or all of this for students who have missed lessons or need additional notes/practice/revision.
The sections cover the following:
1. Sketching graphs of the form y=mod(f(x)) e.g. y=mod(x-2)
2. Sketching simple transformations of y=mod(f(x)) e.g. y=mod(x)+4
3. Solving equations involving the modulus function. This covers the different types of equations and explains when a sketch may/must be used. e.g. mod(x-4)=6 vs 2x+3=mod(x-1)
4. Solving inequalities involving the modulus function. This covers the different types of inequalities and explains when a sketch may/must be used. e.g. mod(x-4)=mod(2x+1) vs 3x-1=4-mod(x)
There are almost 100 questions in total across the different exercises. Answers to all questions in the exercises are provided, including sketches.
Here is an example of one of my A level resources that is freely available:
/teaching-resource/differentiation-and-integration-with-exponential-and-trigonometric-functions-new-a-level-11981186