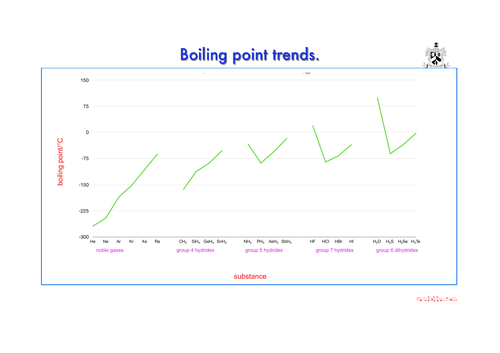
The traditional textbook graph of this data is very confused. I feel that my presentation of the data emphasizes the role played by hydrogen bonding more clearly. The influence of atomic size on boiling point is also clearly shown by the bp of the noble gases.
AFL maybe around the whiteboard, it runs in your browser.
unzip, Click on the states of matter drag & drop.html file (leave everything else alone, please!), press the "go for it " button, and you are away! Enjoy.
Please note: in order to provide a rich interactive experience, my interactive resources are mini-web sites local to your computer. After unzipping, they comprise a folder containing the main “states of matter drag & drop.html” file and another folder containing the graphic resources and my coding to make the resource work. Double click on the “states of matter drag & drop.html” file and the resource will work. If, however , you move or delete any of the files from this hierarchy, the resource will not work.
I made a crazy interactive widget thingy about heating curves
just for fun, around the whiteboard or on individual computers or tablets. Runs in the browser.
Please note: in order to provide a rich interactive experience, my interactive resources are mini-web sites local to your computer. After unzipping, they comprise a folder containing the main “heating curve.html” file and another folder containing the graphic resources and my coding to make the resource work. Double click on the “heating curve.html” file and the resource will work. If, however , you move or delete any of the files from this hierarchy, the resource will not work.
Once you have it in the browser, simply press the “go for it” button and drag away to your heart’s content.
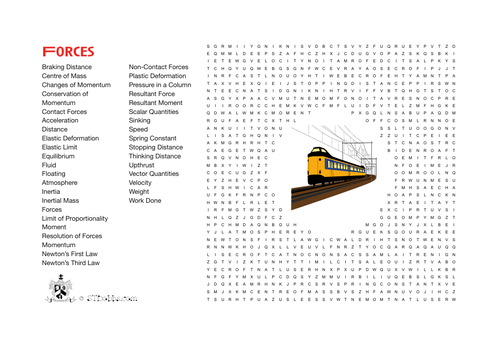
A little bit of ‘learning without working’ activity for the end of term, in black and white for easy cheap photocopying. Suitable for all abilities, but earlier years may need to look some clues up. The answers are included.