Maths resources.
Working on Project-A-Lesson. A full lesson in a PowerPoint. For busy teachers who still want outstanding engaging tasks and learning checks
Maths resources.
Working on Project-A-Lesson. A full lesson in a PowerPoint. For busy teachers who still want outstanding engaging tasks and learning checks
Trying to use variation theory
My thinking
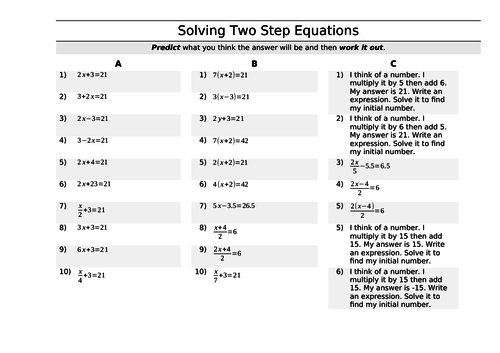
A question to start
Reversing the terms. Does balancing still work?
A subtraction. How does this effect our balance.
Does reversing the terms still lead us to the same answer
Increasing the constant by one. What happens? Also: a decimal answer.
We can have a negative answer
Divide x, instead of multiplying it.
Increasing co-efficient of x by one. What happens to our answer?
Doubling co-efficient of x. Not sure about these last two. I think they may be a step back from question 7. This is the problem with presenting these in a linear format. These questions are variations on question 1, not question 7. I might experiment with some kind of spider diagram.
Doubling the divisor from 7. Again, maybe the linear way these are written is a bit rubbish.
Don’t know how I like the order of these questions, but there’s lots to think about and something to tweak.
I have found the transition to asking ‘why have they asked you that question? What are they trying to tell you?’ has been difficult for some students, but I think it’s worth devoting time to it. If students are inspecting questions for things like this, maybe they’re more likely to read the question thoroughly and pick out it’s mathematics. Big hope, I know.
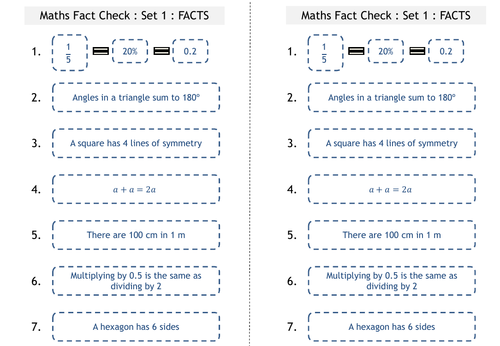
Made these as a way of drilling into my students useful facts that they should commit to memory (ie 1/5 = 0.2).
Made to be used like old spelling tests. Give out the facts. Students use memory techniques like covering up etc to remember them,
Then they can be given a follow up test (included) to see how much they’ve remembered.
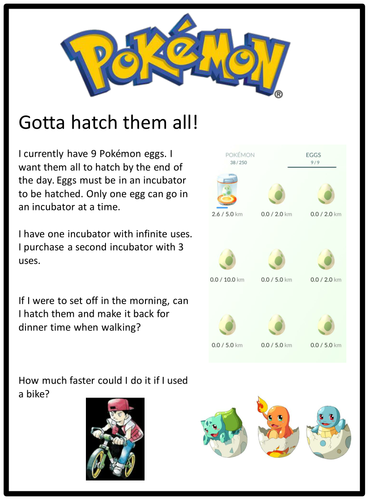
Starter about hatching eggs and a rich task involving student developing a plan to maximise XP and minimise time spent.
Made by a colleague who is shy to upload stuff. I understand none of it. Much thanks to him.
Massively based on @Dooranran 's stuff.
Speed distance time
Nets
Areas of circles/volumes of spheres
Symmetry
Pie charts
Equations of lines
Proportion
Reading graphs
Misleading graphs.
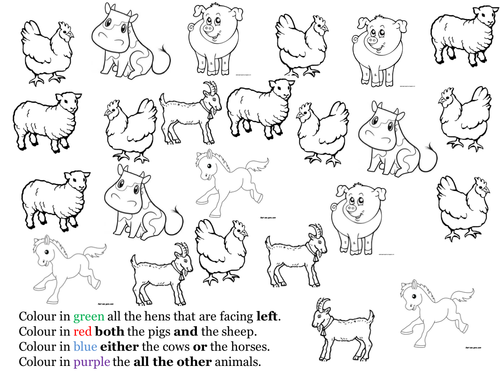
A resource for P Level maths.
Created this because I have a nurture student who finds it difficult to tell the difference between both, all and other directional statements.
Will do more if people want. This area of maths interests me.
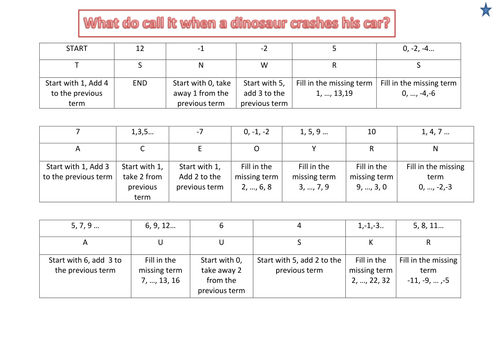
A worksheet for simple sequences, both generating from a written rule, and finding the missing number.
Students start at T. They then answer the question at the bottom of the letter, to find the answer at the top of their next letter. And so on.
If they complete this it should spell out the punchline 'Tyrannosaurus Wrecks&'
GCSE algebra card sort. Really simple excel card sort.
Cut out the tables, the equations and the graphs. Students have to match them together.
As always, please comment and rate with suggestions for improvement.
Changelog: 2 new sections. Changed some answers to address more misconceptions.
Completely redone version of maths pointless.
The countdown is now much, much quicker (as requested).
New questions will also be coming in an update over the following weeks.
Play over numerous rounds and keep score on the board.
All credit to Paul Collins.
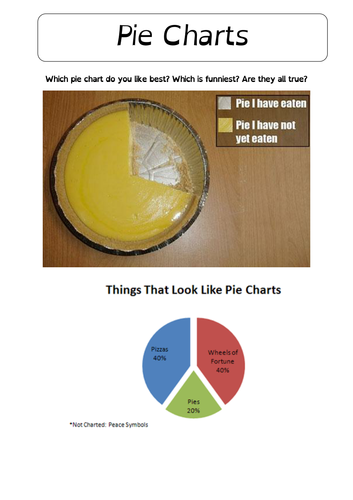
A few pie charts that represent funny ideas or jokes. The idea is that students get a feel for how pie charts work.
I used it as a Y7 starter to generate discussion. The 'how often charts don't make sense' pie chart is particularly good for this.
As always, please rate and comment with suggests and ideas.
Thanks :)
Worksheet. Interpreting/Representing data. A selection of misleading/confusing graphs culled from newspapers and online.
Useful to talk about the difference between misleading and confusing/wrong.
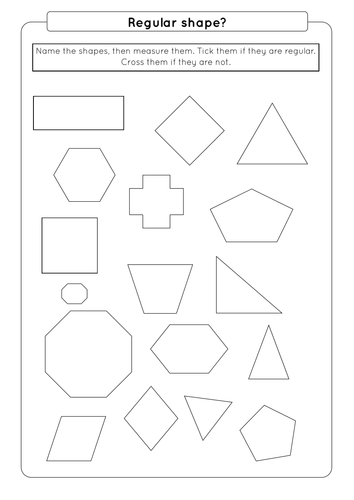
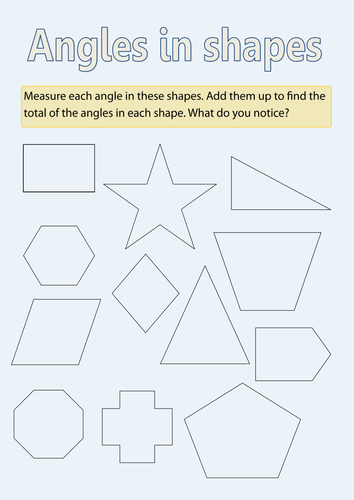
Students measure sides of shape to determine if it is regular or not.
As always, please comment if you found this useful, have an idea on how to improve it, or want something changed.
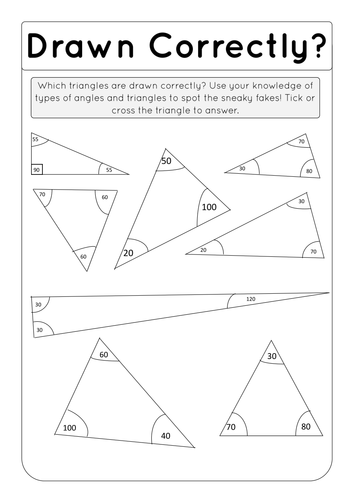
Students are shown 8 triangles. They have to assess if the traingles shown are mathematically valid.
Some of the triangles do not add up to 180 dregrees. Some triangles have clear acute angles lables as obtuse angles.
As an extention, some pupils can give written reasons WHY some of the traingles are not correct.
NOTE: These are not drawn to scale, and are not to assess students ability to measure angles with a protractor. They are as a test of student's knowledge about the internal angles of a triangle.


![Misleading graphs [updated 15/7/14]](https://dryuc24b85zbr.cloudfront.net/tes/resources/6169377/image?width=500&height=500&version=1405419190000)