
These PowerPoint presentations are a series of 4 lessons on bar and tally charts aimed at the year 3 national curriculum.
Learning objectives:
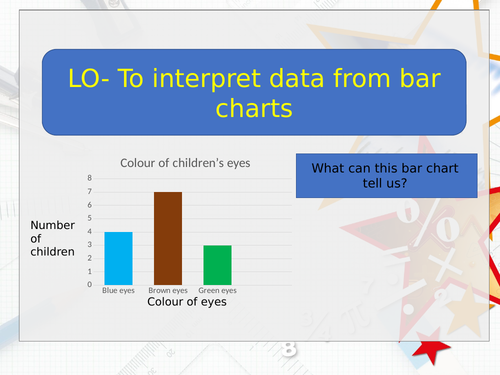
1- To interpret data from a bar chart
2- To use addition and subtraction knowledge
3- To present and interpret data from bar and tally charts
4- To present data in a bar chart
Something went wrong, please try again later.
This resource hasn't been reviewed yet
To ensure quality for our reviews, only customers who have purchased this resource can review it
to let us know if it violates our terms and conditions.
Our customer service team will review your report and will be in touch.
ÂŁ1.00