
How do catalysts affect rate of reaction? How do you draw a reaction profile for a catalysed reaction and a Maxwell Boltzmann distribution curve for a catalysed reaction? All this and more covered in this comprehensive lesson with questions and answers! This is a Year 12 A level lesson for Edexcel International Unit 2 – WCH12, but it can also be used for all UK exam boards. All the slides in this lesson are fully animated and include answers to every mini plenary question and exam question. The breakdown of the slides (which are best opened on Microsoft PowerPoint) is as follows:
Slide 1 - Title and 5-minute starter. The starter is a grid of four questions entitled ‘last week, last lesson, today’s learning and future learning’. Use this generic slide for all of your lessons by simply changing the questions and the answers each time.
Slide 2 - Lesson objectives (see thumbnail image)
Slide 3 – How do catalysts work?
Slide 4 - This image depicts how a catalyst does not lower the activation energy any more than a tunnel lowers a mountain; rather, the catalyst just like the tunnel provides an alternative pathway and it is that pathway which has a lower activation energy
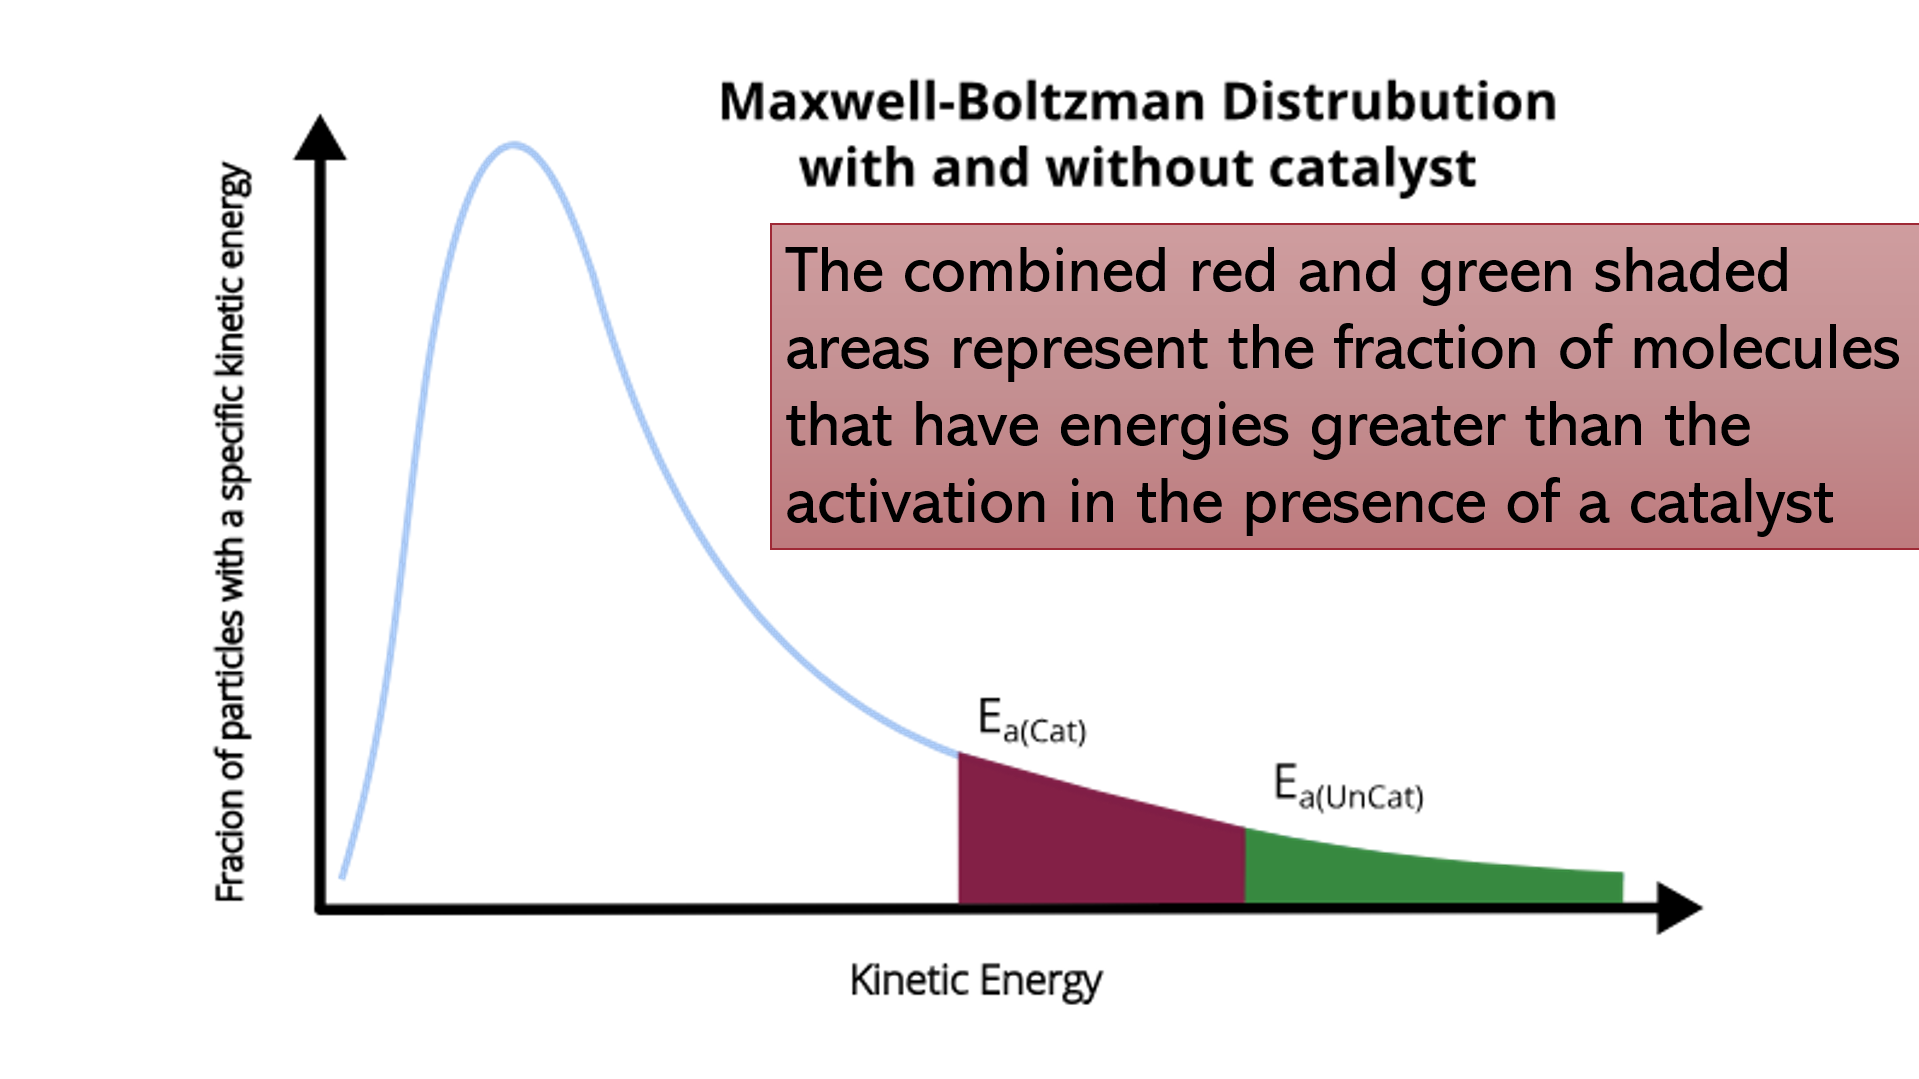
Slide 5 - Maxwell boltzmann distribution curves with and without catalysts
Slide 6 - the following mini whiteboard question: draw a reaction profile diagram for a catalysed and uncatalyzed exothermic reaction. Answer animates on to the screen
Slides 7 - 8: how to draw a reaction profiles for reactions which go via an intermediate
Slide 9 - advantages of catalysts in industry
Slides 10-17: Exam questions with mark scheme answers (included with the purchase of this resource)
If you have a positive experience with the resource, please leave a positive review! This really helps promote our store! Thanks!
Something went wrong, please try again later.
Perfect resource
to let us know if it violates our terms and conditions.
Our customer service team will review your report and will be in touch.
£3.00