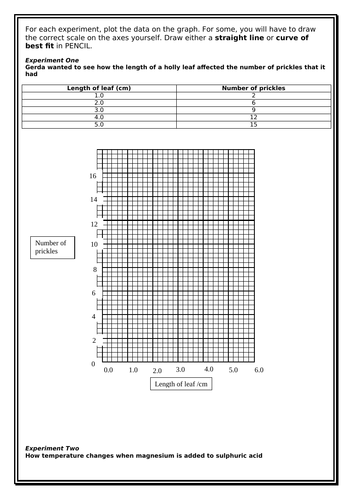
Students practise plotting line graphs of data: task builds slowly from plotting points and drawing best fit lines, to constructing scales and using appropriate labels on axes. Final page tests graph interpretation, and question 3 can be adapted to suit your syllabus and your area.
Has worked extremely well with KS3 and weak KS4 pupils in maths and science lessons.
Something went wrong, please try again later.
Some nice straight forward practical examples.
to let us know if it violates our terms and conditions.
Our customer service team will review your report and will be in touch.
£2.00
