
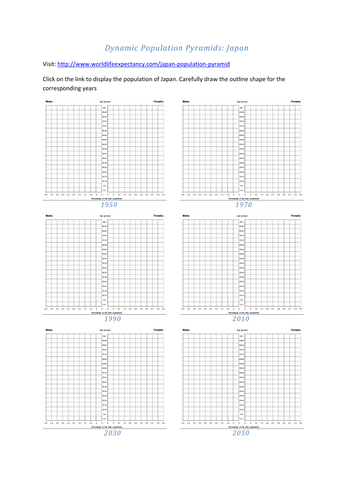
Students draw the outline shape of Japan's population structure as it changes over time as it moves through stages of development and the demographic transition model. (Requires access to ICT / Internet)
The teachers' version could easily be laminated and converted into a card sort as a starter plenary activity etc for pupils to place in the correct order.
The teachers' version could easily be laminated and converted into a card sort as a starter plenary activity etc for pupils to place in the correct order.
Something went wrong, please try again later.
This resource hasn't been reviewed yet
To ensure quality for our reviews, only customers who have downloaded this resource can review it
to let us know if it violates our terms and conditions.
Our customer service team will review your report and will be in touch.
ÂŁ0.00