Last updated
6 July 2016
Share this
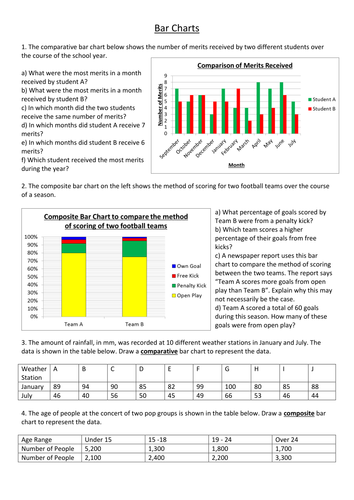
A PPT and accompanying worksheet covering how to draw and interpret comparative and composite bar charts.
Tes classic free licenceSelect overall rating(no rating)
Your rating is required to reflect your happiness.
It's good to leave some feedback.
Something went wrong, please try again later.
Thank you for sharing your work, it was exactly what I needed.
Empty reply does not make any sense for the end user
Empty reply does not make any sense for the end user
Empty reply does not make any sense for the end user
Empty reply does not make any sense for the end user
The bar charts questions are exactly what I was looking for, thank you very much for sharing this.
Empty reply does not make any sense for the end user
to let us know if it violates our terms and conditions.
Our customer service team will review your report and will be in touch.