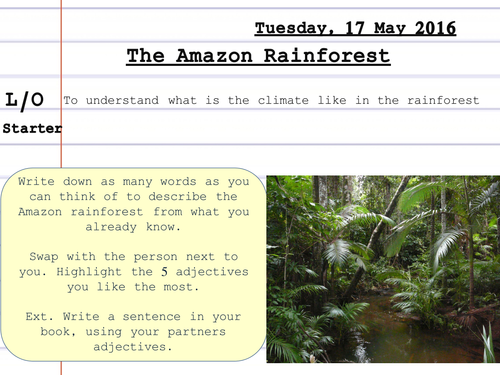


Resource to help students understand and create a climate graph for Manaus, Brazil.
Differentiated for lower ability students.
Choice of extension task to develop interpretation and description of climate graphs.
Differentiated for lower ability students.
Choice of extension task to develop interpretation and description of climate graphs.
Something went wrong, please try again later.
These were easy for my students to use.
Most thankful for this banknof resources. Thank you for creating and sharing them so generously. So helpful and time saving during such a stressful time for the teaching community.
Fab resource, thank you!
to let us know if it violates our terms and conditions.
Our customer service team will review your report and will be in touch.
£0.00
