
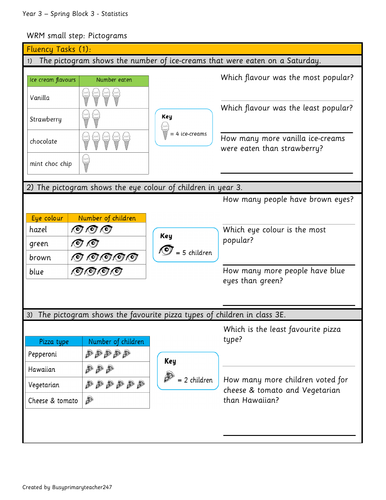
This resources enables children to read and interpret information from pictograms, make comparisons and ask questions about data.
WRM Small Step: pictograms
Curriculum links:
-Interpret and present data using bar charts, pictograms and tables.
-Solve one-step and two-step questions [for example, ‘How many more?’ and ‘How many fewer?’ using information presented in scaled bar charts and pictograms and tables.
Enjoy!
Your feedback is always welcome x
Edited
Error on Q4 has been corrected.
Something went wrong, please try again later.
We are pleased to let you know that your resource Year 3 - interpreting pictograms (1), has been hand-picked by the Tes resources content team to be featured in /teaching-resources/blog/primary-maths-statistics in May 2025 on /teaching-resources/blog. Congratulations on your resource being chosen and thank you for your ongoing contributions to the Tes Resources marketplace.
Just what I needed! Thank you!
Perfect, thank you!
Perfect for what I needed - thank you!
to let us know if it violates our terms and conditions.
Our customer service team will review your report and will be in touch.
£0.00