
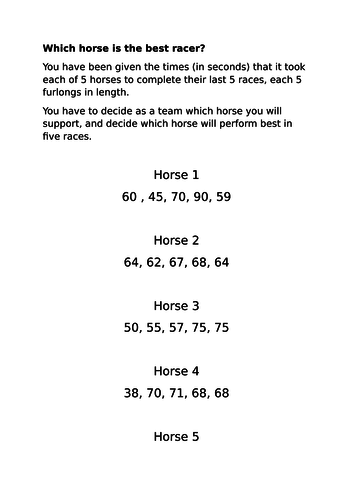
This activity invites learners to use calculator skills to find the mean and standard deviation, using statistics students work together to decide on which horse will do the best of 5 races. The powerpoint presentation animates the horse race.
Something went wrong, please try again later.
Great idea and animations on the ppt, thanks for sharing
Useful.
to let us know if it violates our terms and conditions.
Our customer service team will review your report and will be in touch.
ÂŁ0.00