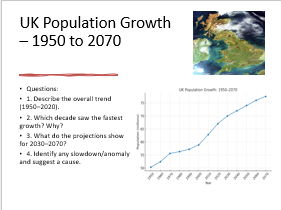


Kick-start your UK Urban Change unit with a clear, data-rich introduction to population distribution. Students begin by predicting where people live on a blank UK map, then compare their ideas with a population-density map and a decade-by-decade UK population trend graph (1950–2070). They explore physical factors (relief, climate, coasts, resources) and human factors (industry, jobs, transport, universities, regeneration) using a tidy two-column slide, before practising a 4-mark exam description with a model answer for self/peer assessment. Ready-to-teach PPT, worksheet, and extension tasks make this lesson accessible and stretchable—perfect for building secure geographical knowledge and exam skills from day one.
Something went wrong, please try again later.
This resource hasn't been reviewed yet
To ensure quality for our reviews, only customers who have purchased this resource can review it
to let us know if it violates our terms and conditions.
Our customer service team will review your report and will be in touch.
ÂŁ1.50