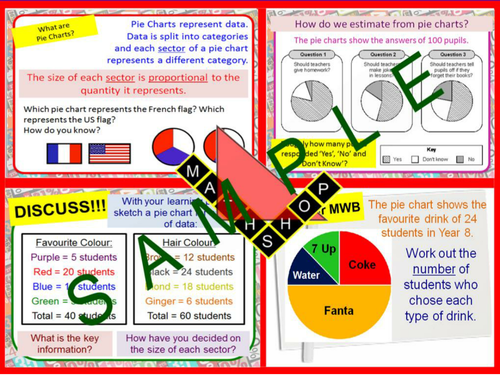
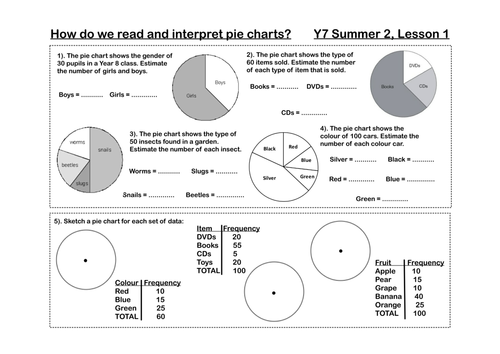
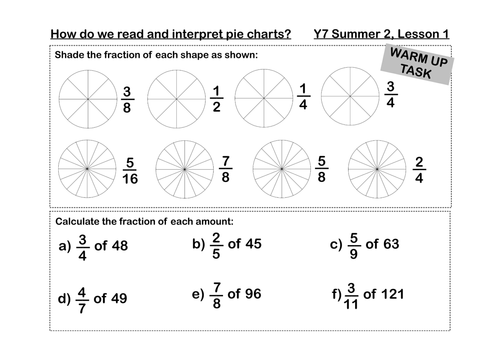
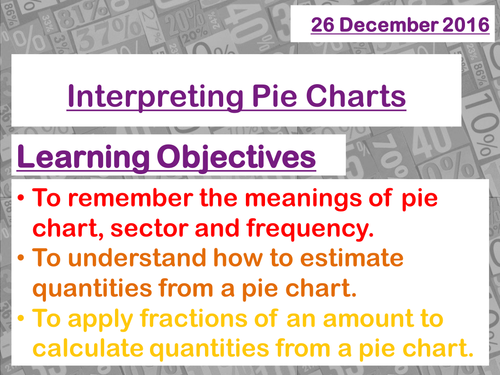
Pie Charts
Subject: Mathematics
Age range: 7-11
Resource type: Lesson (complete)


A bundle is a package of resources grouped together to teach a particular topic, or a series of lessons, in one place.
Limited time only this special price for over ÂŁ30 pounds worth of resources a SPECIAL PRICE. The Great ALL Statistics Bundle filled with worksheets and answers, lesson presentation engaging and interactive. Great for whole lesson or quick fire revision. 11 Resources, Over 15 Lessons worth of resources. Contains GREAT Animated Graphics / tools to make that teaching easier. Ideal for revision or for whole lessons, very well planned and in detail so ideal for either mode. Data Handling Lessons. Enjoy! Ideal for GCSE 9-1 exam practice Ideal for GCSE revision
Limited time only this special price for over ÂŁ30 pounds worth of resources a bargain price. The Great ALL Statistics Bundle filled with worksheets and answers, lesson presentation engaging and interactive. Great for whole lesson or quick fire revision. 11 Resources, Over 15 Lessons worth of resources. Contains GREAT Animated Graphics / tools to make that teaching easier. Data Handling Lessons. Enjoy!
20 Resources. Over 30 Lessons worth of Resources. Each Lesson being 50 minutes. I promise you will not be disappointed. Mainly Area, Angles, Perimeter, Fraction, Pie Charts. You are guaranteed to be happy with what you are buying. Please look at each resource individually for details. Great for quick fire revision or whole lessons.
Something went wrong, please try again later.
We are pleased to let you know that your resource Pie Charts, has been hand-picked by the Tes resources content team to be featured in /teaching-resources/blog/primary-maths-statistics in May 2025 on /teaching-resources/blog. Congratulations on your resource being chosen and thank you for your ongoing contributions to the Tes Resources marketplace.
Engaging, Interactive and Colourful - Students love! Common misconceptions addressed and discussed! All students make progress and understand pie charts! Will use again and again! Thanks!
to let us know if it violates our terms and conditions.
Our customer service team will review your report and will be in touch.