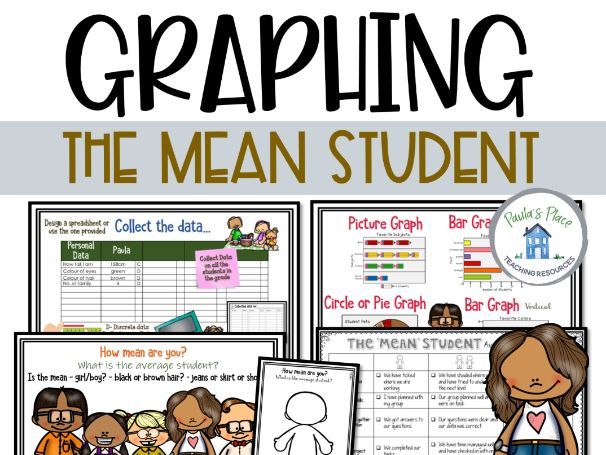

Graphing the Mean - Your students will experience a math task that will lead to a group presentation. They will compose questions, collect data, collate data, determine the ‘mean’, show the data in various graphs and design a poster to present the ‘mean student’.
Slides include
-What the unit will cover
-How mean are you? What will you be looking for?
-What is the mean?
-How mean are you?
-Template for recording the mean student
-Ideas for recording data
-Group guidelines – it’s your turn
-Types of graphs, and examples to share
- Ways to present data
-Collecting proforma ideas
-Extension – mean, median and mode
-Discrete or continuous data
-Making comparisons
-A graph can lie…
-Rubric
Please read the description and download the preview before purchasing. The preview clearly shows you what is included in this pack.
COPYRIGHT ©Paula’s Place
This product is for personal use in one classroom only. To share or use in multiple classrooms, please purchase additional licenses. This product may not be shared or distributed without consent from the author.
Something went wrong, please try again later.
This resource hasn't been reviewed yet
To ensure quality for our reviews, only customers who have purchased this resource can review it
to let us know if it violates our terms and conditions.
Our customer service team will review your report and will be in touch.
£4.00