
Engage your students with this Bar Graph & Tally Chart Activity!
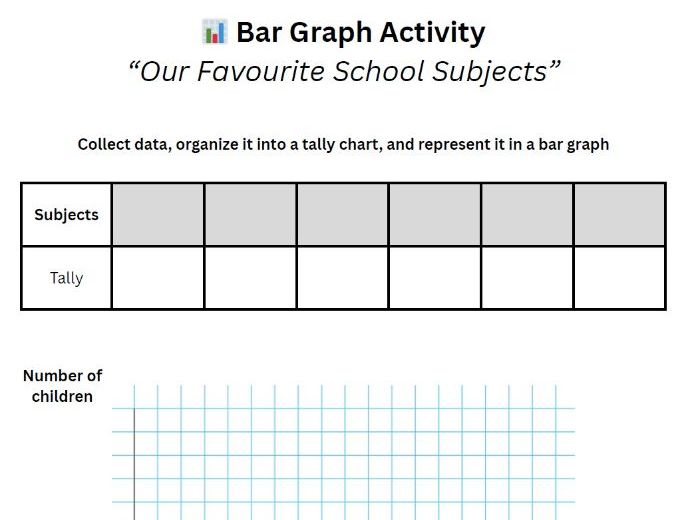
Perfect for introducing data handling, this resource lets pupils survey their classmates on their favourite school subject, record results using a tally chart, and then create a colourful bar graph.
Aligned with maths curriculum objectives, it develops key skills in data collection, representation, and interpretation.
Great for individual or group work, this hands-on activity brings statistics to life while encouraging classroom discussion and critical thinking. Ideal for KS1 and KS2 learners!
Something went wrong, please try again later.
This resource hasn't been reviewed yet
To ensure quality for our reviews, only customers who have downloaded this resource can review it
to let us know if it violates our terms and conditions.
Our customer service team will review your report and will be in touch.
ÂŁ0.00