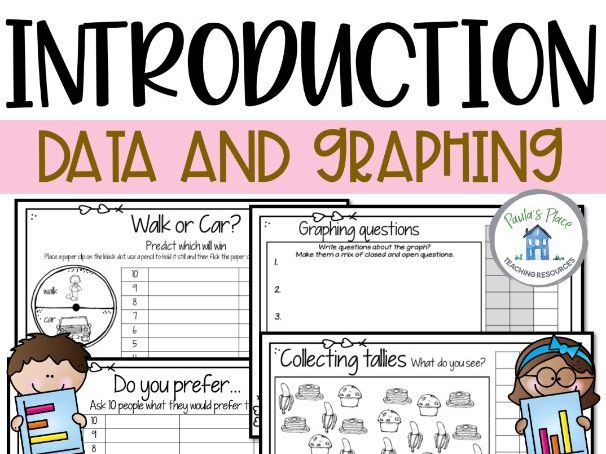

This Graphing ŌĆō An Introduction pack will help build language and skills to create and answer questions about data.
Share the ŌĆśI CanŌĆÖ chart and display it in your classroom. Refer to it at the start and conclusion of each lesson as a reflection.
There are two versions available in the zipped file one for USA and non USA spelling options
Model how to complete the graphs and provide the language needed to obtain the answers from 10 children within the grade
As students organize/organise, represent and interpret data up to three categories they need to ask questions about the total number within each group
They need to be asked and have modelled/modelled questions to work out how many more or less in one category more than another
The students can complete the print and go graphs individually or with a partner
Elaborations - posing questions about themselves and familiar objects and events representing responses to questions using simple displays, including grouping students according to their answers using data displays to answer simple questions such as ŌĆśhow many students answered ŌĆ£yesŌĆØ to having brown hair?ŌĆÖ
Mathematical language: information, data, questions, display, categories, groups, graph, pictograph, bar graph, spinner, chance, answer
COPYRIGHT ┬®PaulaŌĆÖs Place
This product is for personal use in one classroom only. To share or use in multiple classrooms, please purchase additional licenses. This product may not be shared or distributed without consent from the author.
Something went wrong, please try again later.
This resource hasn't been reviewed yet
To ensure quality for our reviews, only customers who have purchased this resource can review it
to let us know if it violates our terms and conditions.
Our customer service team will review your report and will be in touch.