
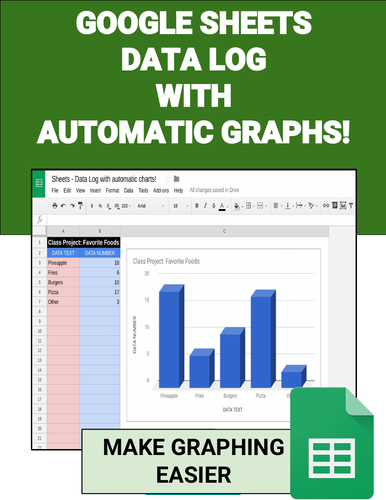
This Google Sheet is setup to create data logs with automatic graphs. It is very easy to use. Students enter their data in the colored cells and the graph is automatically created.
Included:
• 5 different graph types. One on each tab.
• Each graph has room for 200 entries. Decide how many to use.
• Information page on using tabs.
• Information page on using the chart.
• Information page on using the graphs.
Some Usage Ideas:
• Surveys
• Math Facts
• Grades
• Science Labs
Students will never lose their data graphs again as this uses Google Drive!
Something went wrong, please try again later.
This resource hasn't been reviewed yet
To ensure quality for our reviews, only customers who have purchased this resource can review it
to let us know if it violates our terms and conditions.
Our customer service team will review your report and will be in touch.
$2.00